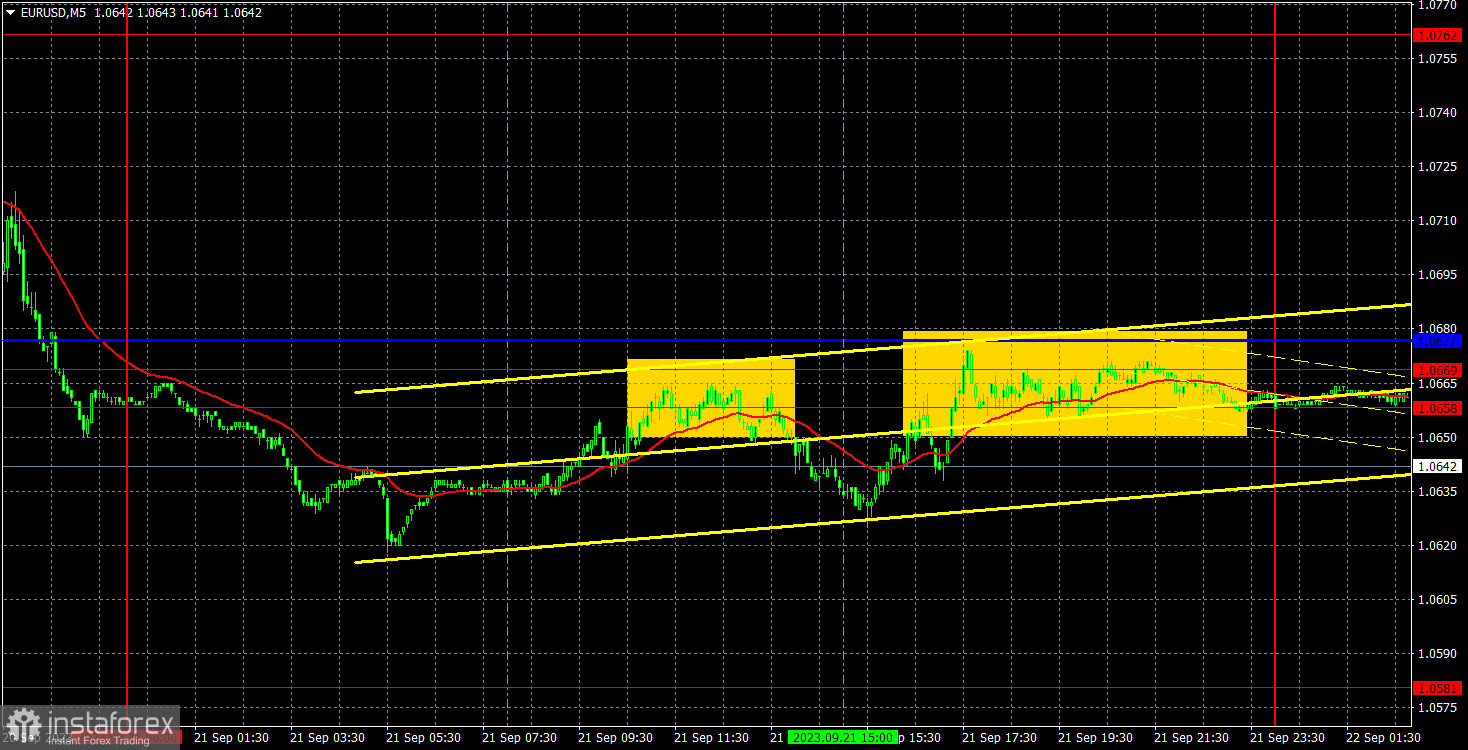
Analysis of EUR/USD 5M
EUR/USD showed significantly more volatility on Thursday. It's worth noting that the pair saw little volatility in recent weeks, and we have only seen substantial price movements on selected days. This was the case when the European Central Bank held its meeting last Thursday and during the Federal Reserve meeting this Wednesday. On all other days, we witnessed weak movements, bordering on a "flat" market. Yesterday was no exception. Despite the fact that the Bank of England left interest rates unchanged in a surprise move, the euro, which typically reacts to such events, had almost no market response this time. If there was no reaction to the BoE meeting, then secondary U.S. reports certainly couldn't provoke one. Perhaps there was a 20-30 pip move, but we can hardly consider that an impact, and there's no profit to be made from it. Moving on, the euro is currently trying to correct higher, but it's not going well, and the downtrend persists.
Speaking of trading signals, there were only two of those on Thursday, and traders could only execute one. In the middle of the European trading session, the price bounced off the 1.0658-1.0669 range and fell by about 18 pips. This was enough to set a Stop Loss at breakeven, and the short position was closed there.
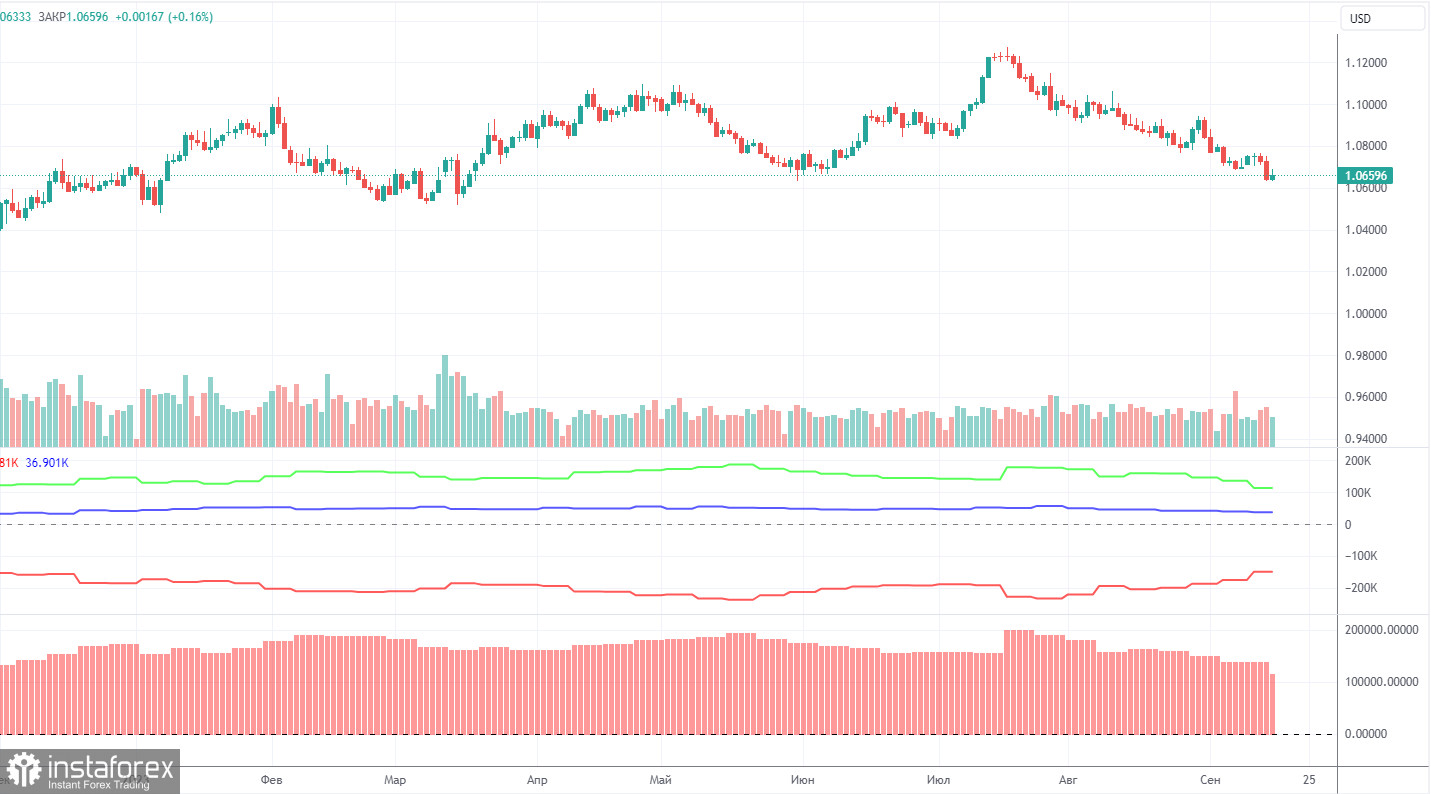
COT report:
On Friday, a new COT report for September 12 was released. Over the last 12 months, COT reports fully corresponded to what is happening in the market. The chart above clearly shows that the net position of major traders (the second indicator) began to grow in September 2022 and at about the same time the euro started rising too. In the last 6-7 months, the net position has not risen but the euro remains at very high levels and is declining rather slowly. Nonetheless, it is still declining. Any significant decline often starts from a small one. At the moment, the net position of non-commercial traders is bullish and remains strong, but the euro is gradually falling.
I have already mentioned the fact that a fairly high value of the net position signals the end of an uptrend. Perhaps that time has come. The red and green lines are very far from each other, and they have even started to converge. Usually, it precedes the end of the trend. Therefore, we believe that the uptrend is coming to an end. During the last reporting week, the number of long positions of the non-commercial group of traders decreased by 23,300 and the number of short ones fell by 200. The net position decreased by 23,100 contracts. The number of long positions is higher than the number of short ones of non-commercial traders by 113,000but the gap is narrowing, which is a good sign. Even without COT reports, it is obvious that the euro should decline, and the COT reports support this scenario.
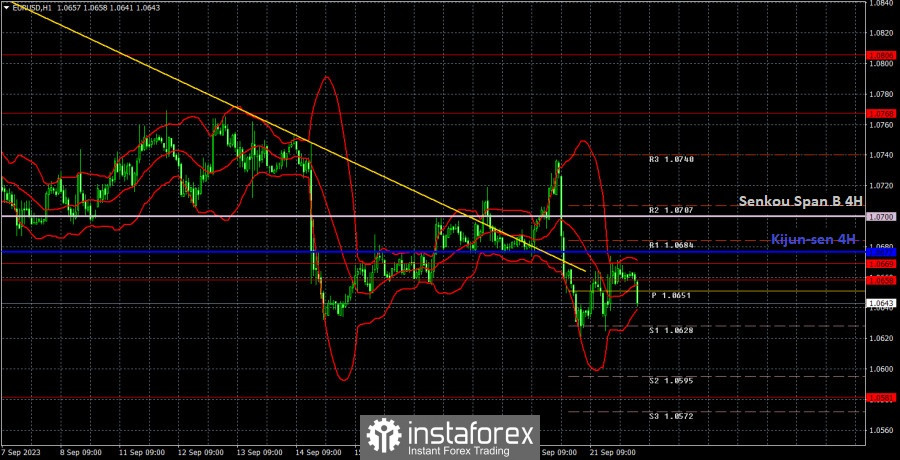
Analysis of EUR/USD 1H
On the 1H chart, the currency pair maintains a downtrend despite breaking the Kijun-sen line and the trendline. Yesterday, we warned you that breakouts, breaches, and other signals could be false. We believe that the dollar will continue to rise in the medium term, but the pair could still enter a bullish correction in the near future. Right now, there are no signs of starting this correction.
On September 22, traders should pay attention to the following key levels: 1.0485, 1.0537, 1.0581, 1.0658-1.0669, 1.0768, 1.0806, 1,0868, 1.0935, 1.1043, 1.1092, as well as the Senkou Span B line (1.0700) and the Kijun-sen (1.0677). The lines of the Ichimoku indicator can move during the day, which should be taken into account when determining trading signals. There are support and resistance levels that can be used to lock in profits. Traders look for signals at rebounds and breakouts. It is recommended to set the Stop Loss orders at the breakeven level when the price moves in the right direction by 15 pips. This will protect against possible losses if the signal turns out to be false.
On Friday, Germany, the European Union, and the United States will release Manufacturing and Services PMI data. Some of these indices may have unexpected values and could potentially provoke a market reaction. However, we do not expect a strong reaction to these reports.
Description of the chart:
Support and resistance levels are thick red lines near which the trend may end. They do not provide trading signals;
The Kijun-sen and Senkou Span B lines are the lines of the Ichimoku indicator, plotted to the 1H timeframe from the 4H one. They provide trading signals;
Extreme levels are thin red lines from which the price bounced earlier. They provide trading signals;
Yellow lines are trend lines, trend channels, and any other technical patterns;
Indicator 1 on the COT charts is the net position size for each category of traders;
Indicator 2 on the COT charts is the net position size for the Non-commercial group.