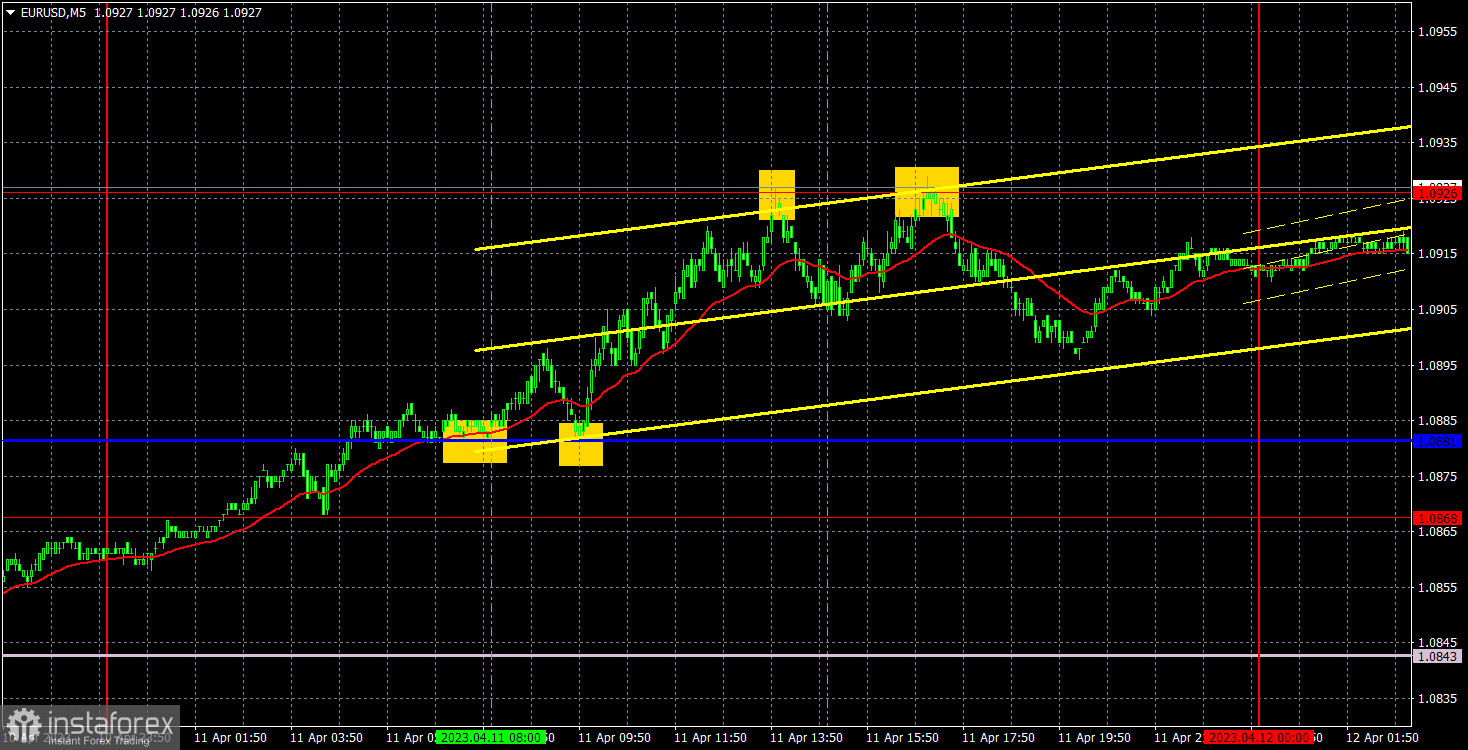
5M chart of EUR/USD
EUR/USD traded higher on Tuesday. On Monday, we could explain the downward movement using the need for a correction, the overbought euro, and traders finally getting the chance to process the US jobs report. But on Tuesday, we don't really know why the dollar fell. There was only one report and that was the eurozone retail sales data. And although it turned out to be slightly better than forecasts, it was still negative, so the euro could not receive support from it. However, market participants still found new reasons to buy. Therefore, the general picture remains the same. The euro continues to either grow or not fall, regardless of whether there is a fundamental background or none, and which currency it supports. On the one-hour chart, we formed a new trend line, the third or the fourth one, and the lines of the Ichimoku indicator were fixed because a flat has also been observed recently.
Speaking of trading signals, they were pretty good, but only if the Senkou Span B and Kijun-sen lines were fixed. Remember that in a flat market, the Ichimoku indicator forms several false signals, so you have to "play" with its lines. The first two buy signals were formed near the critical line, while the last two sell signals were formed near 1.0926. Traders could work with the first signals using a long position, which brought them about 25 points of profit. Based on the sell signals, two positions could be opened. The first one closed at Stop Loss without any loss, and the second one brought another 15 points of profit.
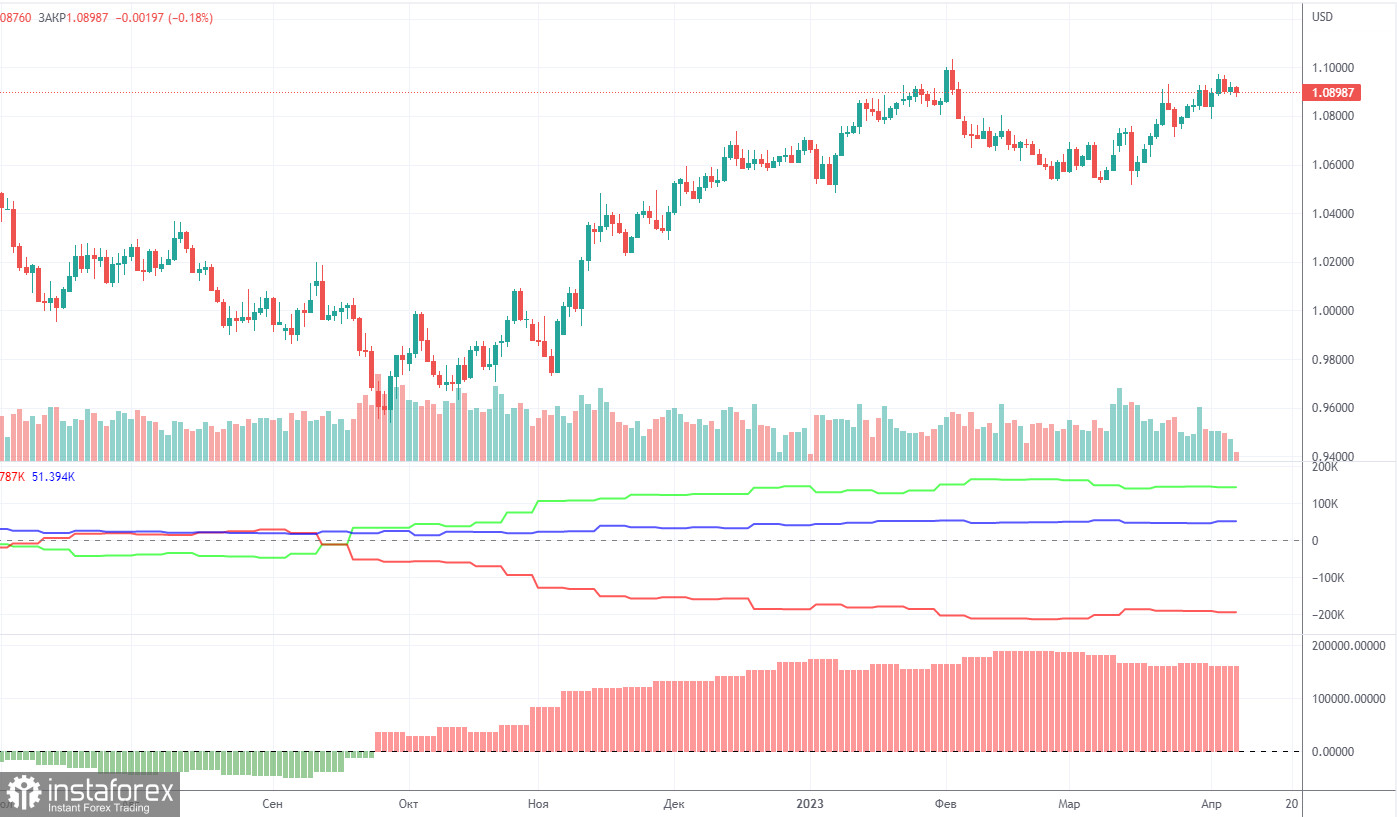
COT report:
On Friday, a new COT report for April 4th was released. The CFTC has caught up with the lost time and now publishes reports that correspond to the current time period. In the past few months, the picture has been entirely consistent with what has been happening in the market. The picture above clearly shows that the net position of major players (the second indicator) has been growing since the beginning of September 2022. At the same time, the European currency also began to rise. At the moment, the net position of non-commercial traders remains bullish and very high, as does the position of the European currency, which cannot even properly correct downward. Importantly, a relatively high "net position" value suggests the scenario that an uptrend will be over soon. This is signaled by the first indicator, where the red and green lines have moved far apart from each other, which often prefaces the end of a trend. The European currency tried to go down, but we have only seen a minor downward retracement so far. During the last reporting week, the number of Buy contracts among the non-commercial group increased by 2,500, while the number of short contracts rose by 4,100. Accordingly, the net position has hardly changed. The number of long positions is higher than the number of shorts among non-commercial traders by 143,000. A correction is still on the horizon, so even without COT reports, it is clear that EUR/USD should resume its decline.
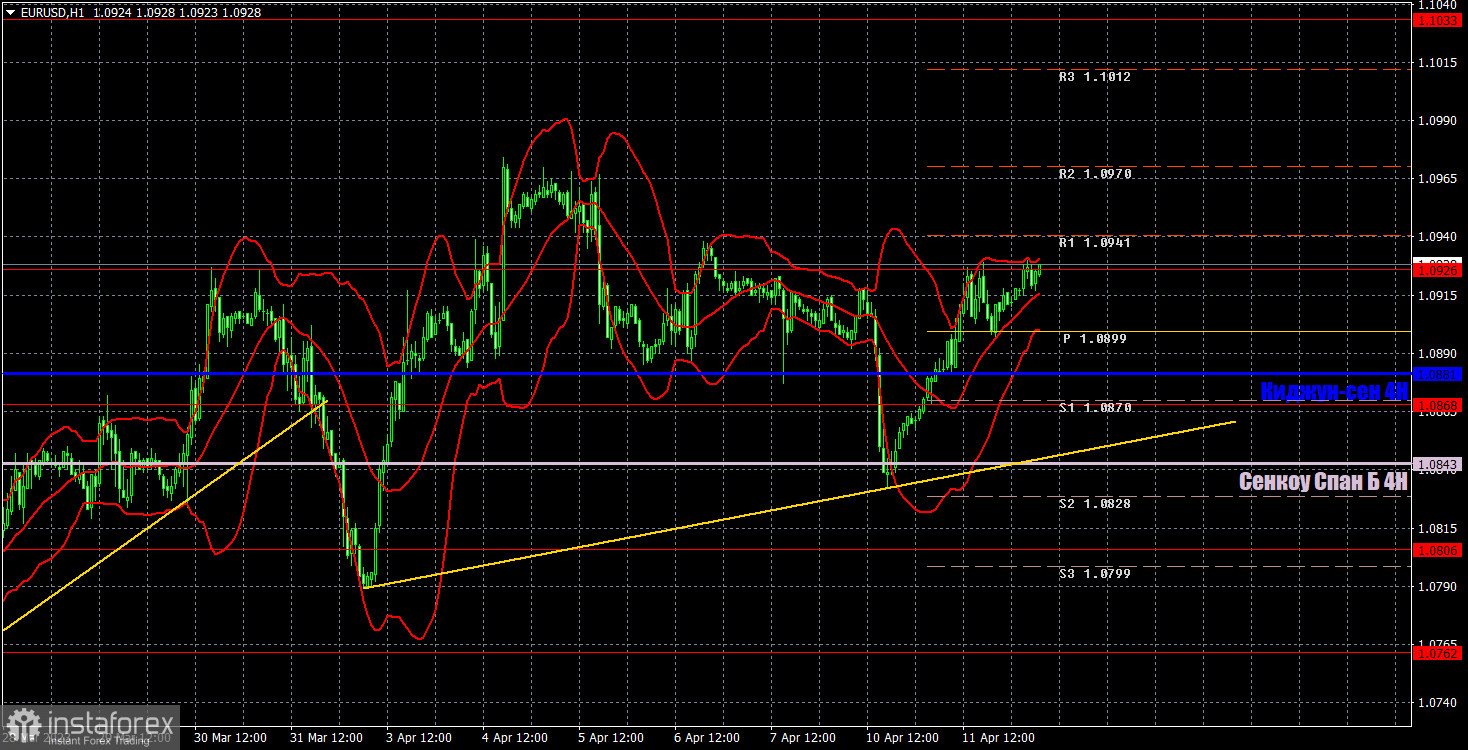
1H chart of EUR/USD
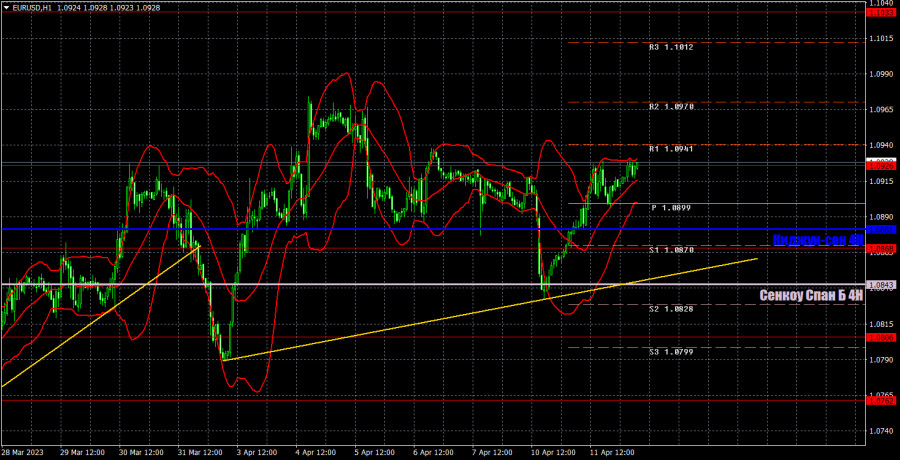
On the one-hour chart, the pair maintains an uptrend, but recently it has been trading flat. The euro can rise at any moment for no good reason. We can consider starting a downtrend on the one-hour chart once the pair settles below the Ichimoku indicator lines, but so far, this seems to be quite difficult, even though both lines are close. Traders still refuse to sell, and without short positions, we won't see a correction. On Wednesday, important levels are seen at 1.0581, 1.0658-1.0669, 1.0762, 1.0806, 1.0868, 1.0926, 1.1033, 1.1137-1.1185, 1.1234, 1.1274 as well as Senkou Span B (1.0843) and Kijun Sen (1.0881). Ichimoku indicator lines can move intraday, which should be taken into account when determining trading signals. There are also support and resistance although no signals are made near these levels. They could be made when the price either breaks or rebounds from these extreme levels. Do not forget to place Stop Loss at the breakeven point when the price goes by 15 pips in the right direction. In case of a false breakout, it could save you from possible losses. On April 12, no important events are scheduled in the European Union. Meanwhile, a crucial inflation report will be published in the United States, which will undoubtedly receive a reaction.
Indicators on charts:
Resistance/support - thick red lines, near which the trend may stop. They do not make trading signals.
Kijun-sen and Senkou Span B are the Ichimoku indicator lines moved to the hourly timeframe from the 4-hour timeframe. They are also strong lines.
Extreme levels are thin red lines, from which the price used to bounce earlier. They can produce trading signals.
Yellow lines are trend lines, trend channels, and any other technical patterns.
Indicator 1 on the COT chart is the size of the net position of each trader category.
Indicator 2 on the COT chart is the size of the net position for the Non-commercial group of traders.