empty
 
 
17.03.2023 11:46 AM
EUR/USD and GBP/USD trading plan for beginners on March 17, 2023

Details of the economic calendar on March 16

The European Central Bank (ECB) expectedly raised the key interest rate by 50 basis points to 3.5% but also pointed to reduce its balance sheet by 15 billion euros per month. Everything is within market expectations.

The regulator stressed that its future rate decisions would depend on incoming data.

Regarding the turbulence in the banking sector, the ECB said that everything is stable and, if anything, the regulator has all the tools to support and provide liquidity.

The euro's reaction to the ECB's decisions was a subsequent recovery in value.

Analysis of trading charts from March 16

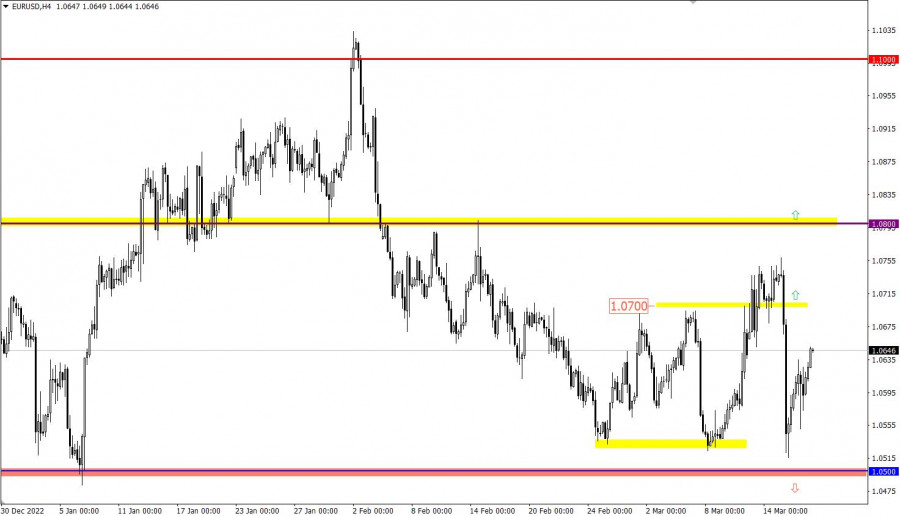
EUR/USD recovered by more than 50% after the recent fall. The 1.0500 support level, from which the step-by-step growth in the volume of long positions started, acts as a support.

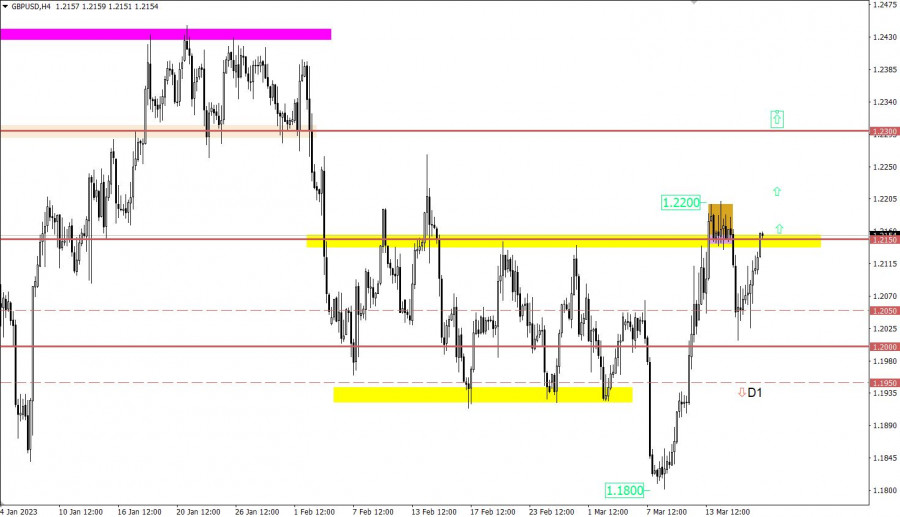
GBP/USD has fully offset the recent decline. The quote returned above the level of 1.2150, which indicates the prevailing upward mood among market participants.

This image is no longer relevant

Economic calendar for March 17

Today, the focus is on the final data on inflation in the Eropean Union. Economists estimate that data should come out in line with preliminary estimate of 8.5%. The data is already priced in, but if it turns out different than forecasts, this may cause speculative price fluctuations.

Time targeting:

EU Inflation Data – 10:00 UTC

EUR/USD trading plan for March 17

In the current situation, the euro may continue to rise towards 1.0700. As for more significant price changes, for them to occur, it is necessary to update the local high of the current week.

This image is no longer relevant

GBP/USD trading plan for March 17

Presumably, a stable holding of the price above the level of 1.2150 will lead to a subsequent increase in the volume of long positions. In turn, this may contribute to further growth of the pound sterling towards the level of 1.2300.

This image is no longer relevant

What's on the charts

The candlestick chart type is white and black graphic rectangles with lines above and below. With a detailed analysis of each individual candle, you can see its characteristics relative to a particular time frame: opening price, closing price, intraday high and low.

Horizontal levels are price coordinates, relative to which a price may stop or reverse its trajectory. In the market, these levels are called support and resistance.

Circles and rectangles are highlighted examples where the price reversed in history. This color highlighting indicates horizontal lines that may put pressure on the asset's price in the future.

The up/down arrows are landmarks of the possible price direction in the future.

Gven Podolsky,
Chuyên gia phân tích của InstaForex
© 2007-2024
Kiếm lợi nhuận từ những biến đổi giá của tiền điện tử với InstaForex.
Tải MetaTrader 4 và mở giao dịch đầu tiên của bạn.
  • Grand Choice
    Contest by
    InstaForex
    InstaForex always strives to help you
    fulfill your biggest dreams.
    THAM GIA CUỘC THI
  • Tiền gửi lần truy cập
    Ký quỹ tài khoản của bạn với $3000 và nhận được $5000 nhiều hơn!
    Trong Tháng 11 chúng tôi xổ $5000 trong chiến dịch Chancy Deposit!
    Có được một cơ hội giành chiến thắng bằng việc ký quỹ $3000 vào một tài khoản giao dịch. Đáp ứng được điều kiện này, bạn trở thành một người tham gia chiến dịch.
    THAM GIA CUỘC THI
  • Giao dịch khôn ngoan, thành công
    Nạp tiền vào tài khoản của bạn với ít nhất $ 500, đăng ký cuộc thi và có cơ hội giành được các thiết bị di động.
    THAM GIA CUỘC THI
  • 100% tiền thưởng
    Cơ hội duy nhất của bạn để nhận 100% tiền thưởng khi gửi tiền
    NHẬN THƯỞNG
  • 55% Tiền thưởng
    Đăng ký tiền thưởng 55% cho mỗi lần gửi tiền của bạn
    NHẬN THƯỞNG
  • 30% tiền thưởng
    Nhận 30% tiền thưởng mỗi khi bạn nạp tiền vào tài khoản của mình
    NHẬN THƯỞNG

Các bài báo được đề xuất

Không thể nói chuyện ngay bây giờ?
Đặt câu hỏi của bạn trong phần trò chuyện.
Widget callback