empty
 
 
30.12.2022 07:43 AM
Outlook and trading signals for GBP/USD on December 30. COT report. Analysis of market situation. The pound is ending the year in a flat.

M5 chart of GBP/USD

This image is no longer relevant

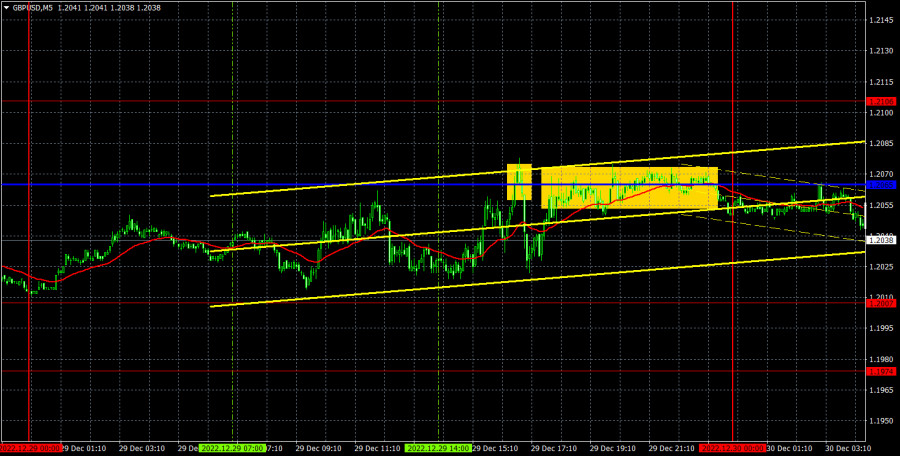
GBP/USD traded between 1.2007 and 1.2106 on Thursday. So while the euro is trying to go back to moving up, the pound is completing its downward movement and going into a flat. The fact that both major currency pairs are moving in completely different directions right now is a bit surprising since there are no fundamental and macroeconomic backdrops at the moment. Nevertheless, this is the holiday period, so illogical and non-standard movements shouldn't be surprising. Today is the last trading day of 2022. Hardly anyone is expecting either strong movements or a trend from the pair. I believe that the pound has not yet fully corrected, so the bearish movement will continue in January 2023.

All of Thursday's trading signals were near the critical line. At the beginning of the US session, the pair rebounded from the Kijun-Sen line and fell 38 pips within 15 minutes. Not much, but it was significant. Of course, this trading signal cannot be considered a real one since GBP did not reach the nearest target level. However, it did pass the 20 points that was required to place the Stop Loss to Breakeven. Then the pair returned to the critical line, but it could neither rebound from it nor cross it, which is why there was no signal.

COT report

This image is no longer relevant

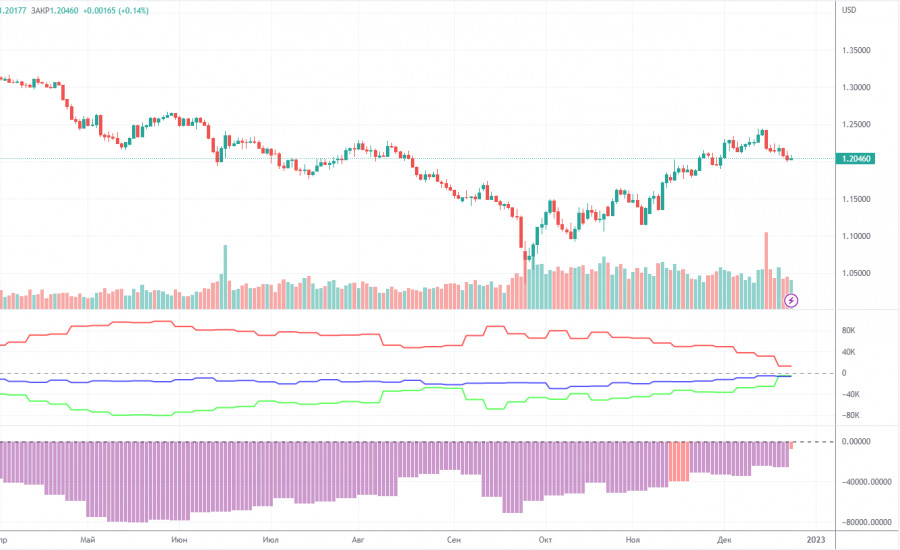
The latest COT report showed a decrease in bearish sentiment. During the given period, non-commercial traders opened 3,200 long positions and closed as many as 16,800 short positions. Thus, the net position grew by about 20,000, which is a lot for the pound. This figure has been on the rise for several months. Nevertheless, sentiment remains bearish, and GBP/USD is on the rise for no reason. I assume that the pair may well resume the downtrend soon since there is a need for at least a correction. Notably, both GBP/USD and EUR/USD now show practically identical movement. Since the net position is not even bullish yet, buying may continue for a few months to come. Non-commercial traders now hold 40,800,000 short positions and 35,200 long ones. The gap between them is small. I am still skeptical about the pound's long term growth, though there are technical reasons for it. At the same time, fundamental and geopolitical factors signal that the currency is unlikely to strengthen significantly.

H1 chart of GBP/USD

This image is no longer relevant

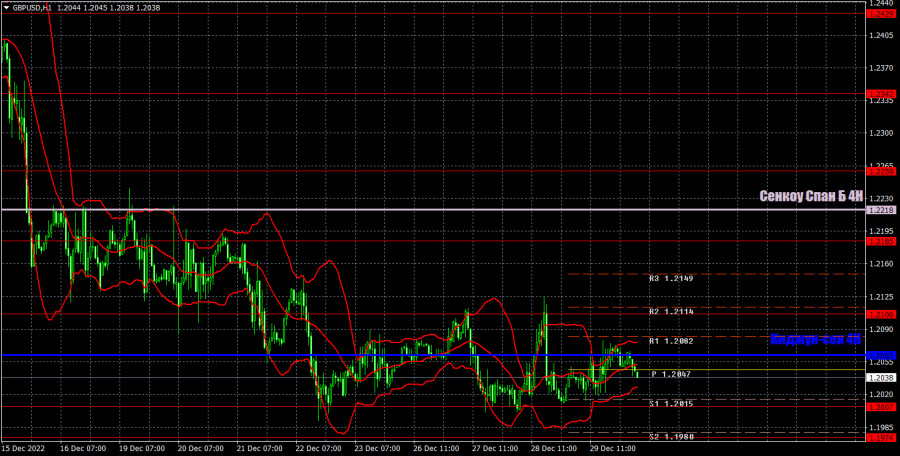
On the one-hour chart, GBP/USD maintains the bearish sentiment but is also in the horizontal channel. If this movement persists, the lines of the Ichimoku indicator may lose their strength in a short time, and we'll have to fix their last acceptable price value, because the pair can cross them 5 times a day in a flat. On December 30, the pair may trade at the following levels: 1.1760, 1.1874, 1.1974-1.2007, 1.2106, 1.2185, 1.2259. Senkou Span B (1.2218) and Kijun Sen (1.2063) lines may also generate signals. Pullbacks and breakouts through these lines may produce signals as well. A Stop Loss order should be set at the breakeven point after the price passes 20 pips in the right direction. Ichimoku indicator lines may move during the day, which should be taken into account when determining trading signals. In addition, the chart does illustrate support and resistance levels, which could be used to lock in profits. There are no important events in the UK and the US, so there will be nothing to react to for today. I believe that the flat may last till the end of the year, or even longer.

What we see on the trading charts:

Price levels of support and resistance are thick red lines, near which the movement may end. They do not provide trading signals.

The Kijun-sen and Senkou Span B lines are the lines of the Ichimoku indicator, moved to the one-hour chart from the 4-hour one. They are strong lines.

Extreme levels are thin red lines from which the price bounced earlier. They provide trading signals.

Yellow lines are trend lines, trend channels, and any other technical patterns.

Indicator 1 on the COT charts reflects the net position size of each category of traders.

Indicator 2 on the COT charts reflects the net position size for the non-commercial group.

Paolo Greco,
Chuyên gia phân tích của InstaForex
© 2007-2024
Kiếm lợi nhuận từ những biến đổi giá của tiền điện tử với InstaForex.
Tải MetaTrader 4 và mở giao dịch đầu tiên của bạn.
  • Grand Choice
    Contest by
    InstaForex
    InstaForex always strives to help you
    fulfill your biggest dreams.
    THAM GIA CUỘC THI
  • Tiền gửi lần truy cập
    Ký quỹ tài khoản của bạn với $3000 và nhận được $5000 nhiều hơn!
    Trong Tháng 11 chúng tôi xổ $5000 trong chiến dịch Chancy Deposit!
    Có được một cơ hội giành chiến thắng bằng việc ký quỹ $3000 vào một tài khoản giao dịch. Đáp ứng được điều kiện này, bạn trở thành một người tham gia chiến dịch.
    THAM GIA CUỘC THI
  • Giao dịch khôn ngoan, thành công
    Nạp tiền vào tài khoản của bạn với ít nhất $ 500, đăng ký cuộc thi và có cơ hội giành được các thiết bị di động.
    THAM GIA CUỘC THI
  • 100% tiền thưởng
    Cơ hội duy nhất của bạn để nhận 100% tiền thưởng khi gửi tiền
    NHẬN THƯỞNG
  • 55% Tiền thưởng
    Đăng ký tiền thưởng 55% cho mỗi lần gửi tiền của bạn
    NHẬN THƯỞNG
  • 30% tiền thưởng
    Nhận 30% tiền thưởng mỗi khi bạn nạp tiền vào tài khoản của mình
    NHẬN THƯỞNG

Các bài báo được đề xuất

Không thể nói chuyện ngay bây giờ?
Đặt câu hỏi của bạn trong phần trò chuyện.
Widget callback