Analysis of EUR/USD, 5-minute chart
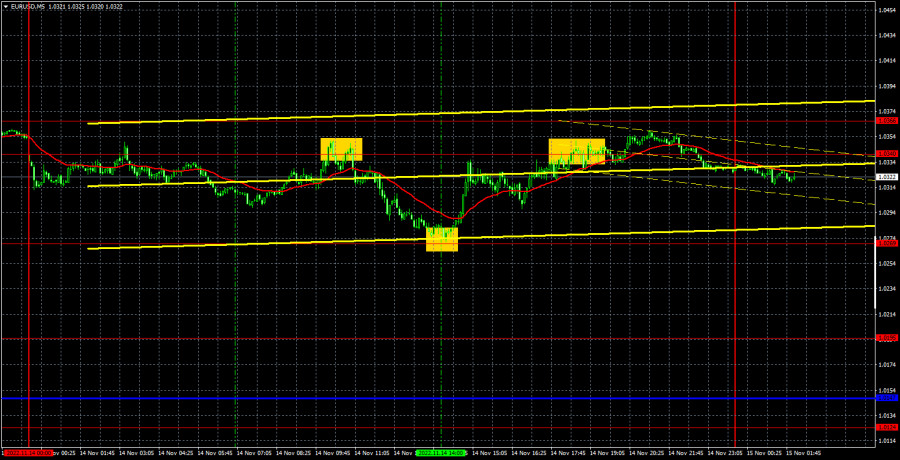
The euro/dollar pair "pretended" that it had corrected. The total volatility of the day was 80 points, which is quite small in the current realities. In the past few months, both currency pairs have shown enviable volatility, so we can expect stronger movements even on Mondays. Yesterday fundamental and macroeconomic backgrounds were virtually absent. There was only one report and it was the industrial production in the European Union, which turned out to be slightly better than expected. However, the market did not react to the data and traded sluggishly and in different directions for most of the day. Therefore, in fact, there was no correction. The ascending trend line remains relevant, and the price is above the Ichimoku indicator lines. Therefore, the trend is definitely up now, but we still expect a significant correction during this week, most likely towards the trend line.
In regards to trading signals, the picture on Monday was close to ideal, despite the flat movement. At first, the pair did not bounce very accurately from the level of 1.0340, which was paired with the level of 1.0366. This signal should have been worked out with a short position. Subsequently, the quotes fell to the target level of 1.0269 and fell short by only a couple of points. However, this is an acceptable error. The profit on the first trade was 45 points, and at the same moment a long position should have been opened. The price rose back to the level of 1.0340 until the evening, where the long positions should have been closed (or a little earlier). Profit - about 45 more points.
COT report
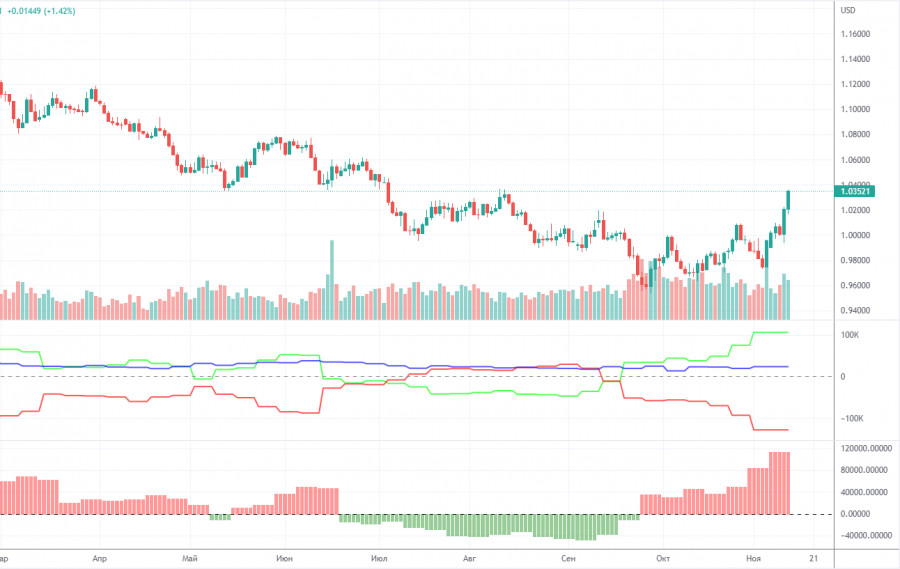
In 2022, the Commitment of Traders (COT) report for the euro is becoming more and more interesting. In the first part of the year, the reports were pointing to the bullish sentiment among professional traders. However, the euro was confidently losing value. Then, for several months, reports were reflecting bearish sentiment and the euro was also falling. Now, the net position of non-commercial traders is bullish again. The euro managed to rise above its 20-year low, adding 500 pips. This could be explained by the high demand for the US dollar amid the difficult geopolitical situation in the world. Even if demand for the euro is rising, high demand for the greenback prevents the euro from growing.
In the given period, the number of long positions initiated by non-commercial traders increased by 13,000, whereas the number of short orders declined by 17,000. As a result, the net position increased by 30,000 contracts. However, this could hardly affect the situation since the euro is still at the bottom. The second indicator in the chart above shows that the net position is now quite high, but a little higher there is a chart of the pair's movement itself and we can see that the euro again cannot benefit from this seemingly bullish factor. The number of longs exceeds the number of shorts by 106,000, but the euro is still trading low. Thus, the net position of non-commercial traders may go on rising without changing the market situation. If we look at the overall indicators of open longs and shorts across all categories of traders, then there are 23,000 more shorts (617,000 vs 594,000).
Analysis of EUR/USD, 1-hour chart
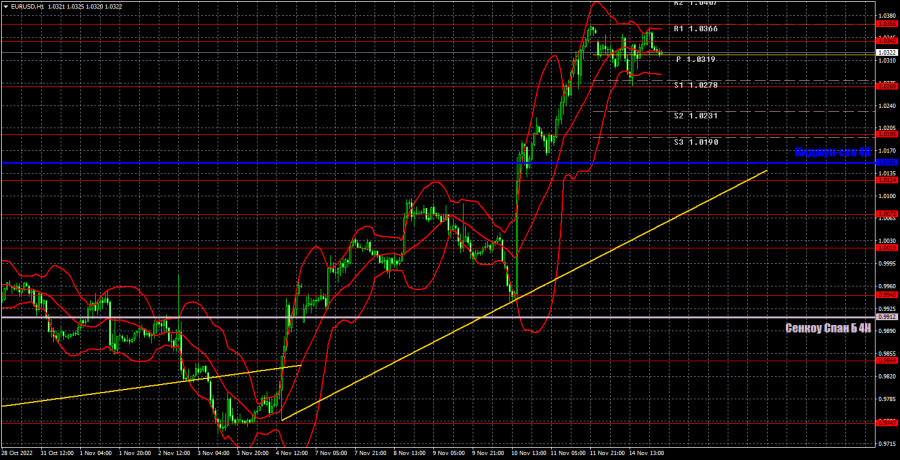
You can see that the pair continues to rise on the one-hour chart, has overcome the Ichimoku cloud on the 24-hour timeframe, as well as all the Ichimoku lines on the 4-hour timeframe. Last week, the reason for the growth was, of course, the US inflation report. If it didn't exist or if it turned out to be weak, then we could see a reverse movement. Now we should expect the euro's growth until the moment when the pair settles below the trend line.
On Tuesday, the pair may trade at the following levels: 1.0072, 1.0124, 1.0195, 1.0269, 1.0340-1.0366, 1.0485, 1.0579, 1.0637, as well as the Senkou Span B (0.9912) and Kijun-sen (1.0151). Lines of the Ichimoku indicator may move during the day, which should be taken into account when determining trading signals. There are also support and resistance levels, but signals are not formed near these levels. Bounces and breakouts of the extreme levels and lines could act as signals. Don't forget about stop-loss orders, if the price covers 15 pips in the right direction. This will prevent you from losses in case of a false signal.
The European Union will publish a report on GDP for the third quarter in the second assessment, and there's nothing in the US. We believe that the pair should start correcting. The next estimate of GDP should not cause a strong market reaction.
What we see on the trading charts:
Price levels of support and resistance are thick red lines, near which the movement may end. They do not provide trading signals.
The Kijun-sen and Senkou Span B lines are the lines of the Ichimoku indicator, moved to the one-hour chart from the 4-hour one. They are strong lines.
Extreme levels are thin red lines from which the price bounced earlier. They provide trading signals.
Yellow lines are trend lines, trend channels, and any other technical patterns.
Indicator 1 on the COT charts reflects the net position size of each category of traders.
Indicator 2 on the COT charts reflects the net position size for the non-commercial group.


