empty
 
 
25.10.2022 11:05 AM
Tips for beginner traders in EUR/USD and GBP/USD on October 25, 2022

Details of the economic calendar of October 24

Preliminary data on the business activity indices of Europe, the United Kingdom, and the United States reflected an overall decline.

Statistics details:

The Eurozone manufacturing PMI for October fell from 48.4 to 46.6 points, with a forecast of 47.8 points. Services PMI fell from 48.8 to 48.2 points, while composite PMI fell from 48.1 to 47.1 points.

The euro reacted to the statistics with a decline.

The UK manufacturing PMI for October fell from 48.4 to 45.8 points, with a forecast of 48.0 points. Services PMI fell from 50.0 to 47.5 points, with a forecast of 47.5 points, while composite PMI fell from 50.0 to 47.5 points.

The pound reacted to the statistics with a decline.

US manufacturing PMI fell from 52.0 to 49.9 in October, compared to a forecast of 51.0. Services PMI fell from 49.3 to 46.6, with a forecast of 49.2, while composite PMI fell from 49.5 to 47.3.

The dollar ignored statistics.

What are they talking about in the media?

Former Chancellor of the Exchequer Rishi Sunak has become the new British Prime Minister. He was chosen by the Conservative Party as their new leader to replace Liz Truss, who resigned as head of government after 45 days in office.

This image is no longer relevant

Analysis of trading charts from October 24

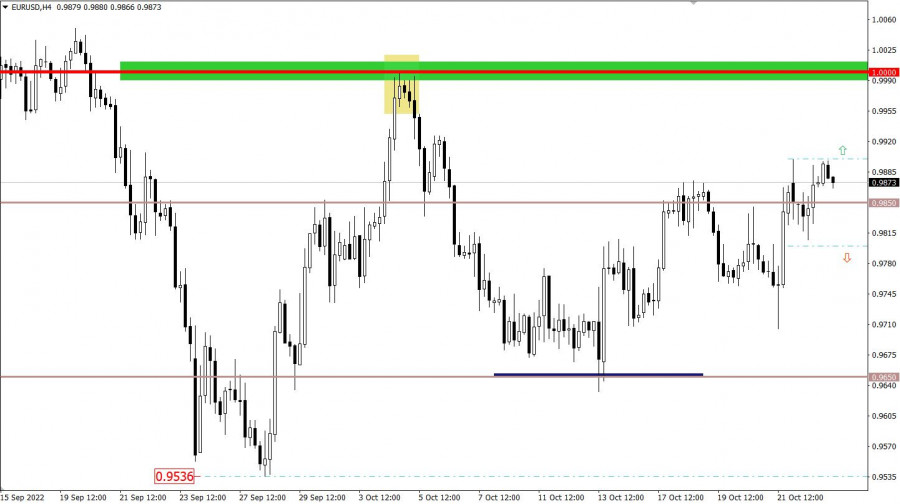
The EURUSD currency pair managed to maintain the upward pace set in the market, as a result of which the quote continued to hold above the intermediate level of 0.9850.

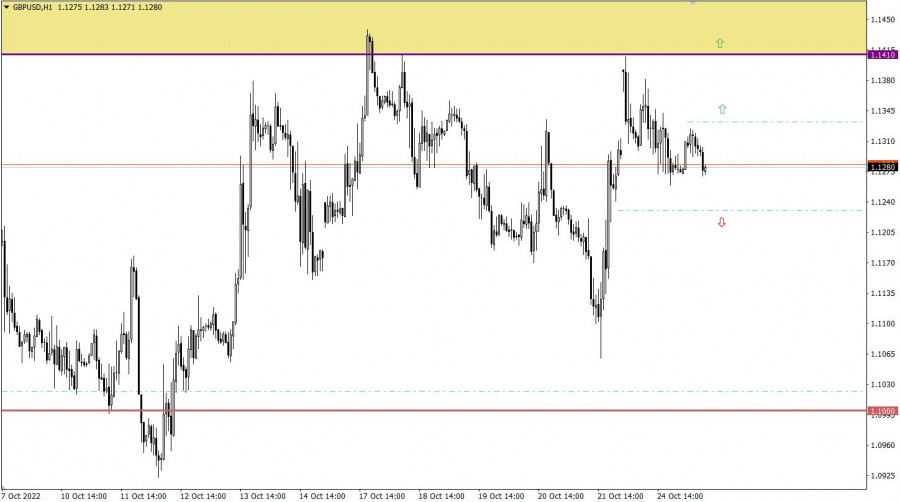
The GBPUSD currency pair once again rebounded from the lower border of the resistance area 1.1410/1.1525. This led to a reverse movement, as a result of which the quote locally fell below 1.1270. Based on the price behavior, it can be assumed that the market is still on the speculators' lead, as indicated by the amount of daily volatility, as well as the recent price gap.

Economic calendar for October 25

Today, the macroeconomic calendar is empty—no statistics are expected in Europe, the United Kingdom, and the United States.

For this reason, investors and traders will pay special attention to the information flow. Statements by the Prime Minister of Great Britain regarding his plans to exit the country from a difficult economic situation may appear in the media. If such a plan is announced and supported by the public, then this will be a good incentive for the growth of the pound sterling.

Rishi Sunak will address the nation at 10:35 UTC.

Trading plan for EUR/USD on October 25

In this situation, there is a distinct stagnation along the level of 0.9850, which, in the theory of technical analysis, can drag on for some time. As a result, there will be a flat, which will become a process of accumulation of trading forces. As for the amplitude limits, it is worth applying the values of 0.9800 and 0.9900 to work. The subsequent price movement will depend on the border beyond which the quote will stay in a four-hour period.

This image is no longer relevant

Trading plan for GBP/USD on October 25

In this situation, the gap serves as a support area with respect to which stagnation was formed. For there to be an increase in the volume of short positions, which in the long term would stimulate sellers of the pound sterling, the quote needs to stay below 1.1230 in a four-hour period.

The upward scenario is currently limited by the lower boundary of the resistance area 1.1410/1.1525. Thus, if the quote held above 1.1410 in a four-hour period, then the pound could at least rise to the upper border of the 1.1525 area, with the possibility of its breakdown.

This image is no longer relevant

What is shown in the trading charts?

A candlestick chart view is graphical rectangles of white and black light, with sticks on top and bottom. When analyzing each candle in detail, you will see its characteristics of a relative period: the opening price, closing price, and maximum and minimum prices.

Horizontal levels are price coordinates, relative to which a stop or a price reversal may occur. These levels are called support and resistance in the market.

Circles and rectangles are highlighted examples where the price of the story unfolded. This color selection indicates horizontal lines that may put pressure on the quote in the future.

The up/down arrows are the reference points of the possible price direction in the future.

Gven Podolsky,
Chuyên gia phân tích của InstaForex
© 2007-2024
Kiếm lợi nhuận từ những biến đổi giá của tiền điện tử với InstaForex.
Tải MetaTrader 4 và mở giao dịch đầu tiên của bạn.
  • Grand Choice
    Contest by
    InstaForex
    InstaForex always strives to help you
    fulfill your biggest dreams.
    THAM GIA CUỘC THI
  • Tiền gửi lần truy cập
    Ký quỹ tài khoản của bạn với $3000 và nhận được $5000 nhiều hơn!
    Trong Tháng 11 chúng tôi xổ $5000 trong chiến dịch Chancy Deposit!
    Có được một cơ hội giành chiến thắng bằng việc ký quỹ $3000 vào một tài khoản giao dịch. Đáp ứng được điều kiện này, bạn trở thành một người tham gia chiến dịch.
    THAM GIA CUỘC THI
  • Giao dịch khôn ngoan, thành công
    Nạp tiền vào tài khoản của bạn với ít nhất $ 500, đăng ký cuộc thi và có cơ hội giành được các thiết bị di động.
    THAM GIA CUỘC THI
  • 100% tiền thưởng
    Cơ hội duy nhất của bạn để nhận 100% tiền thưởng khi gửi tiền
    NHẬN THƯỞNG
  • 55% Tiền thưởng
    Đăng ký tiền thưởng 55% cho mỗi lần gửi tiền của bạn
    NHẬN THƯỞNG
  • 30% tiền thưởng
    Nhận 30% tiền thưởng mỗi khi bạn nạp tiền vào tài khoản của mình
    NHẬN THƯỞNG

Các bài báo được đề xuất

Không thể nói chuyện ngay bây giờ?
Đặt câu hỏi của bạn trong phần trò chuyện.
Widget callback