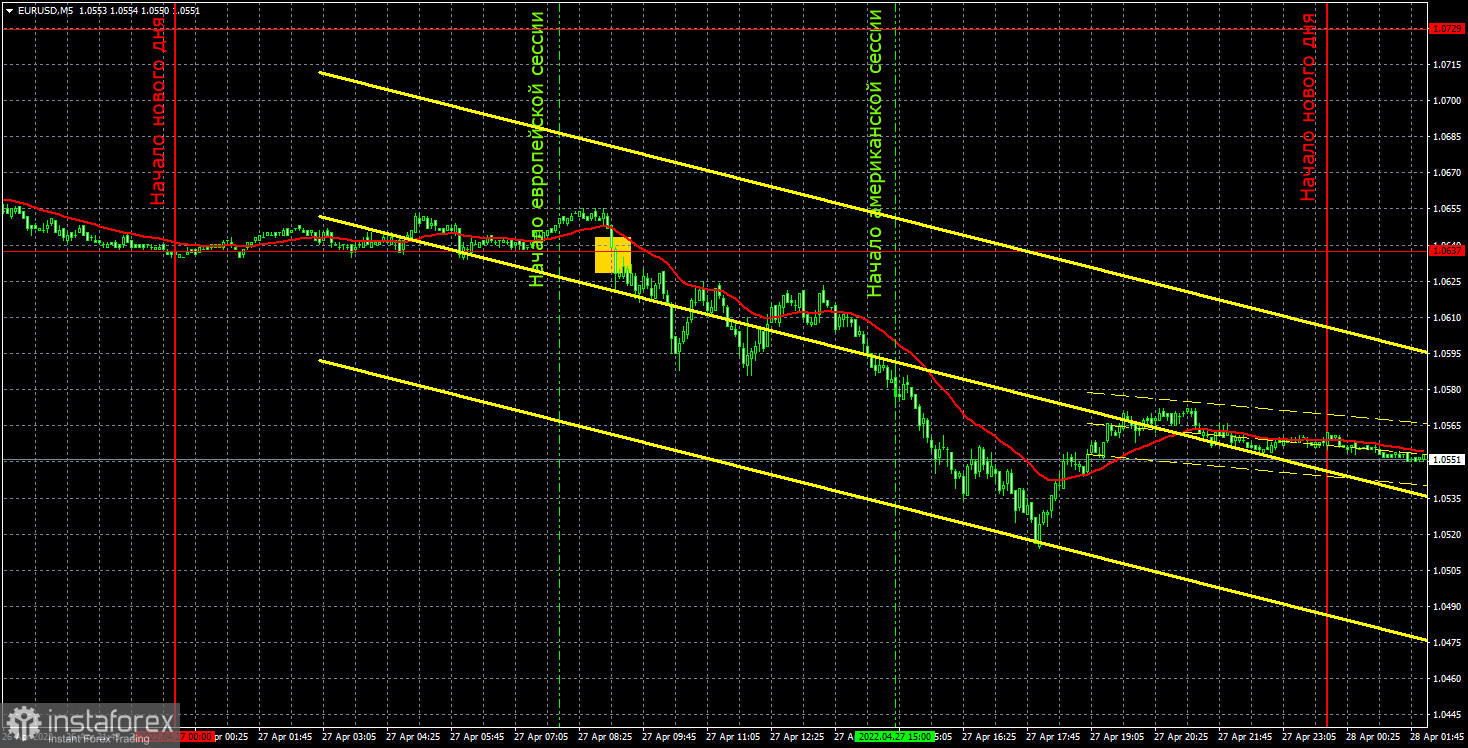
EUR/USD 5M
The EUR/USD pair calmly continued to fall on Wednesday. Over the past five days, the euro has already fallen by 400 points. Volatility remains very high, and the fall continues even without attempts to correct. The pair easily and naturally overcame the level of 1.0637, which was a 5-year low, and now it updates this low every day. There was not a single important macroeconomic event in the United States and the European Union on Wednesday. Only European Central Bank President Christine Lagarde's speech, which did not give any fundamentally new information. And in any case, traders did not even wait for Lagarde's speech, and they started new short positions on the euro immediately when the European session started. The downward trend does not cause any doubts now, but trend lines or a channel (on a 30-minute TF) cannot be formed now. We mean those that will not just visualize the picture, but also show real movement landmarks.
Only one trading signal was generated on the 5-minute TF. The price settled below the extreme level of 1.0637 at the very beginning of the European session, after which it went down more than 100 points. Since there are practically no levels in the current price range, and the Ichimoku indicator lines run much higher, the price did not cross anything interesting during the day. And the short position should have been closed manually later in the evening. The profit on it could be 60-70 points.
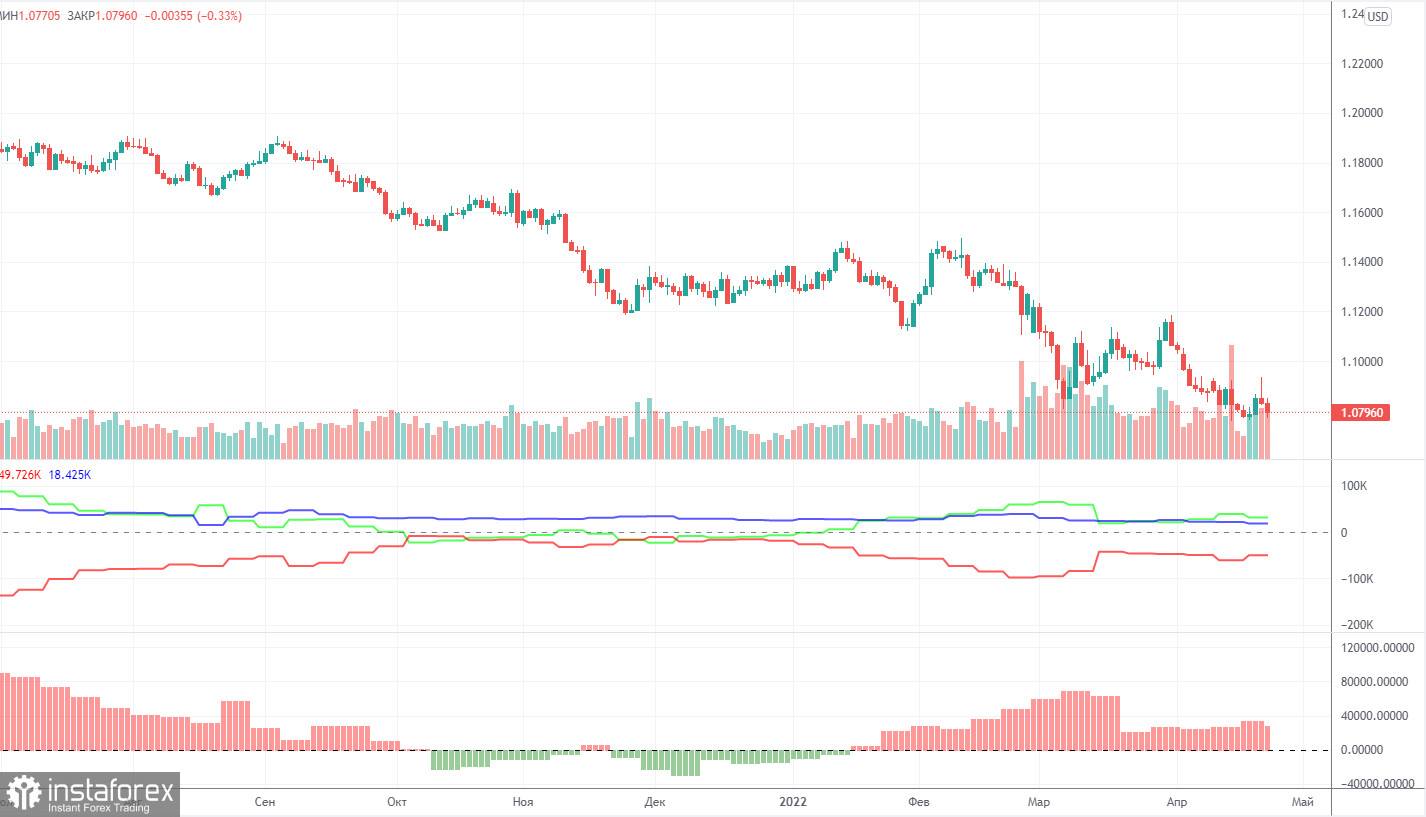
COT report:
The latest Commitment of Traders (COT) reports on the euro raised more questions than they provided answers! Major players, starting from January 2022, maintain a bullish mood. And the euro, starting from January 2022, maintains a downward trend. During the reporting week, the number of long positions decreased by 600, and the number of shorts from the "non-commercial" group increased by 7,000. Thus, the net position decreased by 6,000 contracts. This means that the bullish mood has weakened a bit. However, it still remains bullish, since the number of long positions now exceeds the number of short positions with non-commercial traders by 32,000. Accordingly, the paradox lies in the fact that professional players generally buy euros more than they sell, but the euro continues to fall almost non-stop, which is clearly seen in the chart above. We have already explained earlier that this effect is achieved by a higher demand for the US dollar. The demand for the dollar is higher than the demand for the euro, which is why the dollar is rising against the euro. There is such an effect "due" to the geopolitical conflict in Ukraine. Therefore, the data of COT reports on the euro now do not give an opportunity to predict the further movement of the pair. The longer the phase of active hostilities in Ukraine persists, the higher the probability of a collision between the European Union and the food and energy crisis, and the dollar will continue to grow due to its status as a "reserve" currency.
We recommend to familiarize yourself with:
Overview of the EUR/USD pair. April 28. There will be no truce between Ukraine and Russia. Europe needs to learn to live in new realities.
Overview of the GBP/USD pair. April 28. The American Lend-Lease program has been practically adopted. Arms supplies to Ukraine will increase many times.
Forecast and trading signals for GBP/USD on April 28. Detailed analysis of the movement of the pair and trading transactions.
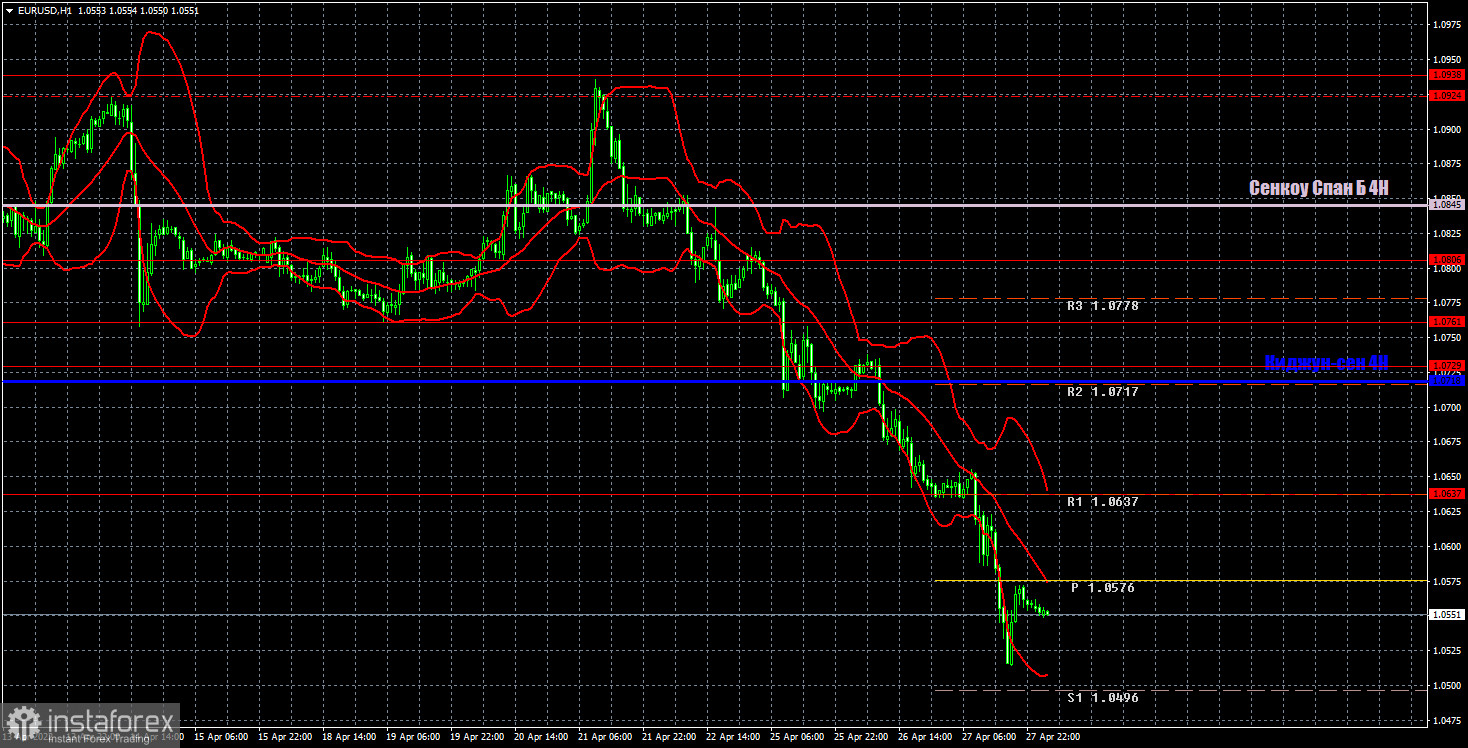
EUR/USD 1H
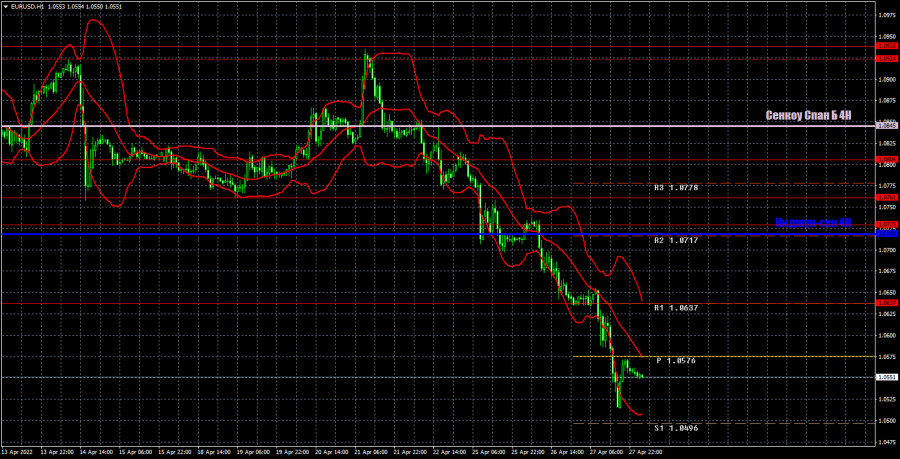
The hourly timeframe shows that the pair continues its downward movement and easily overcame its 5-year lows. Now the pair will aim for its lows over the past 20 years, which are located just above the third level. We believe that the euro can only count on a technical correction now, since all other factors speak in favor of its further decline. However, even a technical correction cannot begin in any way! And this is despite the fact that there are no local factors supporting the fall now. We allocate the following levels for trading on Thursday – 1.0340-1.0369, 1.0637, 1.0729, 1.0761, 1.0806, as well as the Senkou Span B (1.0845) and Kijun-sen (1.0718) lines. The lines of the Ichimoku indicator can move during the day, which should be taken into account when determining trading signals. There are also secondary support and resistance levels, but no signals are formed near them. Signals can be "bounces" and "breakthrough" levels - extremes and lines. Do not forget about placing a Stop Loss order at breakeven if the price went in the right direction of 15 points. This will protect you against possible losses if the signal turns out to be false. There are no interesting events planned for April 28 in the European Union, and there is only a report on GDP for the first quarter in the US, which will help answer the question, how much can the Federal Reserve really raise the rate? This report is considered quite important and may provoke a market reaction.
Explanations for the chart:
Support and Resistance Levels are the levels that serve as targets when buying or selling the pair. You can place Take Profit near these levels.
Kijun-sen and Senkou Span B lines are lines of the Ichimoku indicator transferred to the hourly timeframe from the 4-hour one.
Support and resistance areas are areas from which the price has repeatedly rebounded off.
Yellow lines are trend lines, trend channels and any other technical patterns.
Indicator 1 on the COT charts is the size of the net position of each category of traders.
Indicator 2 on the COT charts is the size of the net position for the non-commercial group.