GBP/USD 5M
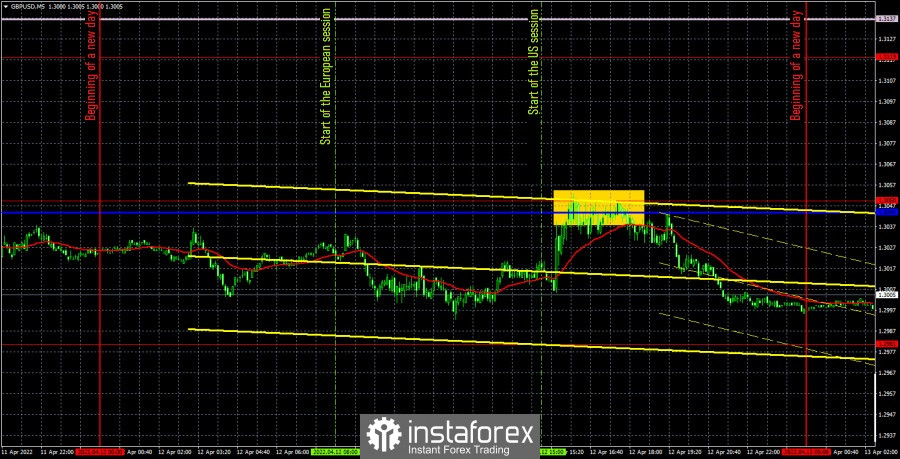
The GBP/USD currency pair was flat all day on Tuesday. This is clearly evidenced, for example, by the higher linear regression channel in the chart above. However, even without this channel, it is clearly visible that the pair was moving sideways. Volatility was low, and the macroeconomic background was strong, so there was little logic in the pair's movements on Tuesday. The British statistics, which were published in the morning, turned out to be quite strong compared to forecasts, but not the most important in its essence. Nevertheless, it could provoke a slight strengthening of the British currency. However, this strengthening did not happen at the European trading session. It began at the US session, when a report on inflation in the United States was published, which increased by another 0.6% in annual terms and was supposed to provoke a strengthening of the dollar. But at that time, the pound was already getting more expensive. And a few hours after the traders failed to overcome the critical line, a new round of decline began. In total, the whole day is flat with an illogical reaction to all the macroeconomic data of the day.
Only one trading signal was formed on Tuesday. At the beginning of the US trading session, the pair reached the Kijun-sen line and the extreme level of 1.3050, from which it successfully rebounded. This rebound was a sell signal that could be worked out (at that time, a couple of hours had passed since the publication of the inflation report). As a result, the pair managed to decline by 20 points by the evening, and that's how much traders could get by opening a short position.
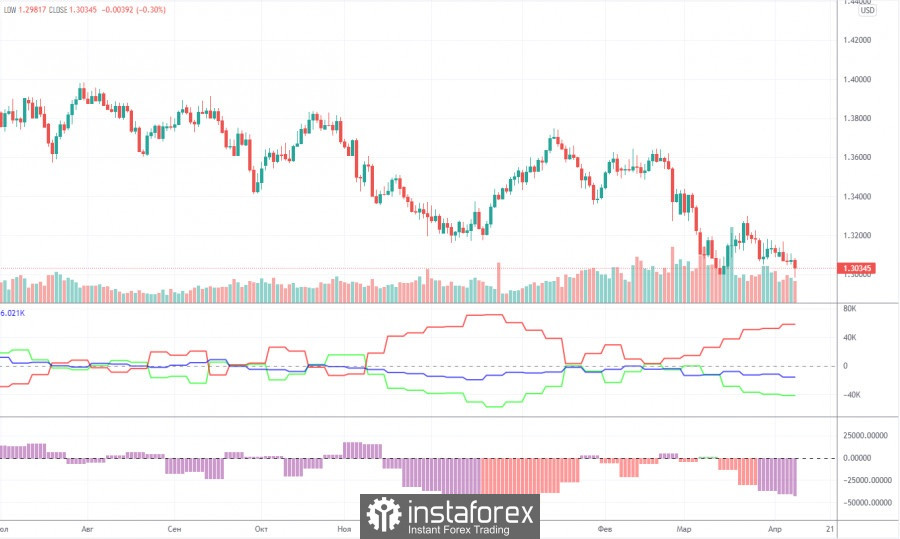
COT report:

The latest Commitment of Traders (COT) report on the British pound showed minimal changes in the mood of major players. For a whole week, the non-commercial group opened 5,200 long positions and 6,900 short positions. Thus, the net position of non-commercial traders decreased by 1,700. Even for the pound, such changes are insignificant. In general, the non-commercial group still has almost 2.5 times more contracts for shorts than longs. This means that the mood of professional traders is now "pronounced bearish". Thus, this is another factor that speaks in favor of the continuation of the pound's fall. The situation with COT reports for the pound is completely different than for the euro. According to the pound, the mood of the major players changes every couple of months, and sometimes even more often. At this time, the net position of the non-commercial group has already fallen to the levels where the last round of the pound's fall ended (the green line on the first indicator). Thus, we can even assume that in the coming weeks the pound will try to start a new ascent. However, the current fundamental and geopolitical background does not give good reasons to expect a strong growth of the British currency. Even taking into account the rate increase by the Bank of England.
We recommend to familiarize yourself with:
Overview of the EUR/USD pair. April 13. US inflation continues to grow by leaps and bounds.
Overview of the GBP/USD pair. April 13. Chip and Dale rush to the rescue: Finland and Sweden are preparing to join NATO.
Forecast and trading signals for EUR/USD on April 13. Detailed analysis of the movement of the pair and trading transactions.
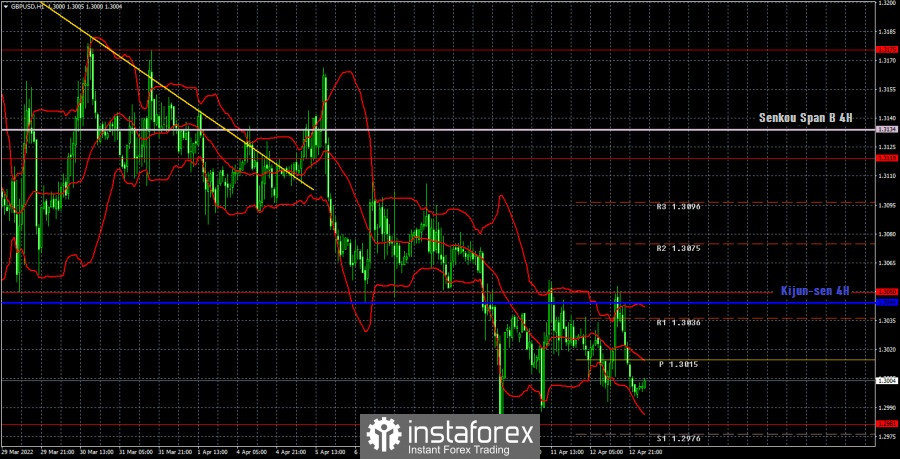
GBP/USD 1H

It is clearly visible on the hourly timeframe how the pair continues its downward movement as a whole. In the last few days, the pound quotes have been in a horizontal channel between the levels of 1.2981 and 1.3050. Thus, now we can even talk about a flat. Bulls remain extremely weak and cannot even overcome the critical line. The pound continues to remain near its 15-month lows and may update them at any time. Most factors speak in favor of the continued growth of the US currency. On April 13, we highlight the following important levels: 1.2981, 1.3050, 1.3119, 1.3175. The Senkou Span B (1.3134) and Kijun-sen (1.3044) lines can also be signal sources. Signals can be "bounces" and "breakthroughs" of these levels and lines. It is recommended to set the Stop Loss level to breakeven when the price passes in the right direction by 20 points. The lines of the Ichimoku indicator can move during the day, which should be taken into account when determining trading signals. There are also support and resistance levels on the chart that can be used to take profits on transactions. The inflation report for March will be released in Great Britain today. It is expected that this indicator will grow as well as in the US, by 0.5-0.6% in annual terms, and will amount to 6.7-6.8%. However, it is almost impossible to predict what the market's reaction to this report will be. A lot will depend on the actual value of inflation and how much it will not match the forecast, and in which direction. However, this report may have a certain impact on the course of trading. Nothing interesting is planned for today in the US.
Explanations for the chart:
Support and Resistance Levels are the levels that serve as targets when buying or selling the pair. You can place Take Profit near these levels.
Kijun-sen and Senkou Span B lines are lines of the Ichimoku indicator transferred to the hourly timeframe from the 4-hour one.
Support and resistance areas are areas from which the price has repeatedly rebounded off.
Yellow lines are trend lines, trend channels and any other technical patterns.
Indicator 1 on the COT charts is the size of the net position of each category of traders.