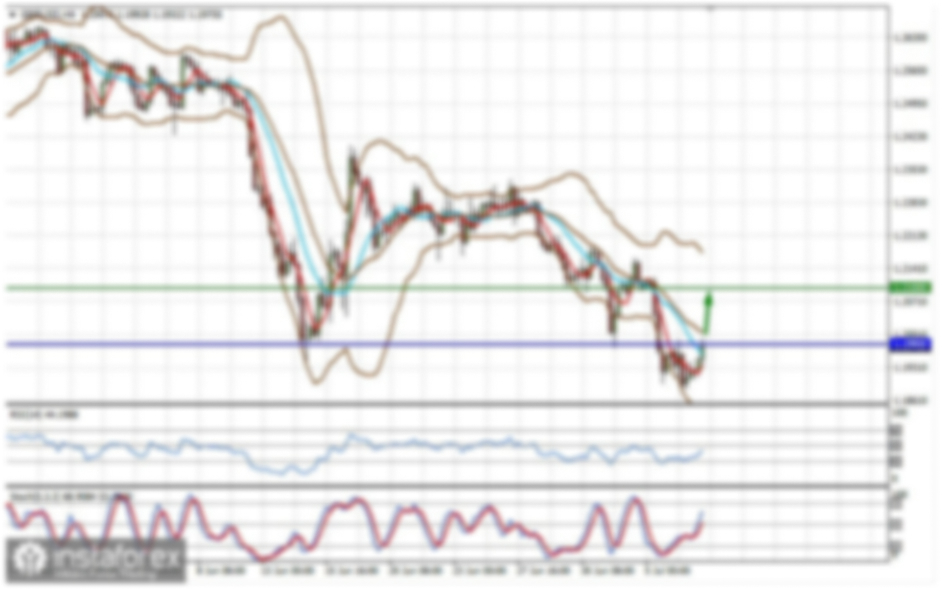
EUR/USD 5M
The EUR/USD pair traded very poorly on May 4. The day started as predicted, with the resumption of the downward movement. We said in the last articles that, everything will probably not end with just one round of downward correction, so we are waiting for another round of the downward movement. And so it happened. However, closer to the afternoon, this movement stopped, and the quotes sharply retreated from their lows, and even more sharply from their highs (local). Thus, the pair changed its direction of movement at least three times during the day, therefore, in general, a flat was observed for the day. If you do not take the Asian session into account, which is when the pair was just in a downward movement, then the movement in the European and US sessions took place strictly between the levels of 1.2000 and 1.2036. That is, in a channel 36 points wide. So if we don't take the night movements into account, which we do not work out, then not only was the pair moving in a horizontal channel all day, but also with low volatility. Consequently, as soon as the normal movement ended (which was observed in the last few days), the profit that could be earned in those few days also ended. It is much more difficult to trade in a flat. Several signals were formed on the 5-minute timeframe, which should still be rejected. Overcoming the Senkou Span B line served as a sell signal. The closest extremum level 1.2003 was reached, and the price bounced off it. Therefore, it was necessary to close short positions here (about 12-13 points in profit) and open long positions while aiming for the Senkou Span B line (1.2030). This line was also worked out and a rebound followed from it, therefore, it was necessary to close longs and open new shorts. A person could have earned 12 points of profit on the long position. However, a new attempt to go down to the 1.2003 level was not crowned with success and the quotes returned to the Senkou Span B line once again, rebounded from it and fell afterwards, passing 40 points within five minutes, and having reached the 1.2003 level , from which there was a rebound again. Thus, another five points of profit and a new buy signal. At least 30 points could be earned even if there is no movement. Important macroeconomic reports were not published during the day.
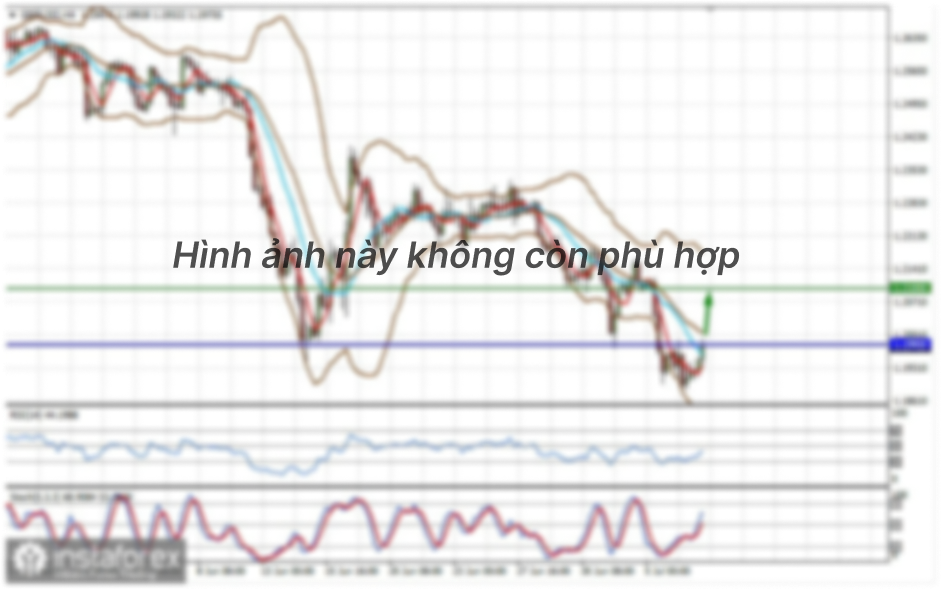
EUR/USD 1H
The hourly timeframe also clearly shows that the movements were in different directions, although there were no events that could provoke sharp price reversals during the day. In general, the upward trend is still there, as both uptrend lines remain relevant. Thus, the quotes may try to continue the correction to these lines and work out one or both. Rebounds off trend lines can also be regarded as buy signals. In general, we are waiting for the resumption of the upward trend, but at the same time, it is the trend lines that will show whether this will be so. In general, we still recommend trading from important levels and lines that are indicated on the hourly timeframe. The nearest important levels are 1.1988, 1.2003 and 1.2076, as well as the Senkou Span B (1.2030) and Kijun-sen (1.2073) lines. Signals can be rebounds or breakthroughs of these levels and lines. Do not forget about placing a Stop Loss order at breakeven if the price moves 15-20 points in the right direction. This will protect you against possible losses if the signal turns out to be false. The European Union is set to publish an index of business activity in the service sector, and in the United States - a report from the ADP on changes in the number of employees in the private sector, the index of business activity in the service sector ISM. Thus, hypothetically, there will be data that can affect the movement of the euro/dollar pair on Wednesday.
We also recommend that you familiarize yourself with the forecast and trading signals for the GBP/USD pair.
COT report
Recall that the EUR/USD pair increased by 50 points during the last reporting week (April 20-26). Take note that major players have been strenuously reducing buy contracts (longs) and opening sell contracts (shorts) since February. However, in the last couple of weeks, there has been an increase in bullish sentiment among the group of non-commercial traders. Let us recall that this is the most important group of traders, which usually determines the trading vector. Professional players opened 5,500 buy contracts and 2,900 sell contracts during the reporting week. Thus, the net position increased by 2,600 contracts. This is not much for the euro. In general, the number of buy contracts remains much higher than that of sell contracts: 202,000 versus 121,000.
Therefore, in general, we can conclude that the upward mood persists among traders and has even slightly strengthened. We also remind you about the factor regarding the injection of trillions of dollars into the American economy, which also affects the dollar exchange rate in the international currency market. Let us remind you that even if the major players sell billions of euros, but at the same time the Federal Reserve prints trillions of dollars, the euro will still go up in price. The Commitment of Traders (COT) reports reflect the actions of major players in the European currency, but do not reflect the actions of the Fed against the dollar. Given the fact that the US government will continue to develop more and more stimulus packages for the economy, we believe that the economy continues to remain in a "post-crisis state", when it is impossible to do without cash injections and incentives. This means that these infusions are in the first place in terms of the degree of influence, and not the actions of large players.
Explanations for the chart:
Support and Resistance Levels are the levels that serve as targets when buying or selling the pair. You can place Take Profit near these levels.
Kijun-sen and Senkou Span B lines are lines of the Ichimoku indicator transferred to the hourly timeframe from the 4-hour one.
Support and resistance areas are areas from which the price has repeatedly rebounded off.
Yellow lines are trend lines, trend channels and any other technical patterns.
Indicator 1 on the COT charts is the size of the net position of each category of traders.
Indicator 2 on the COT charts is the size of the net position for the non-commercial group.