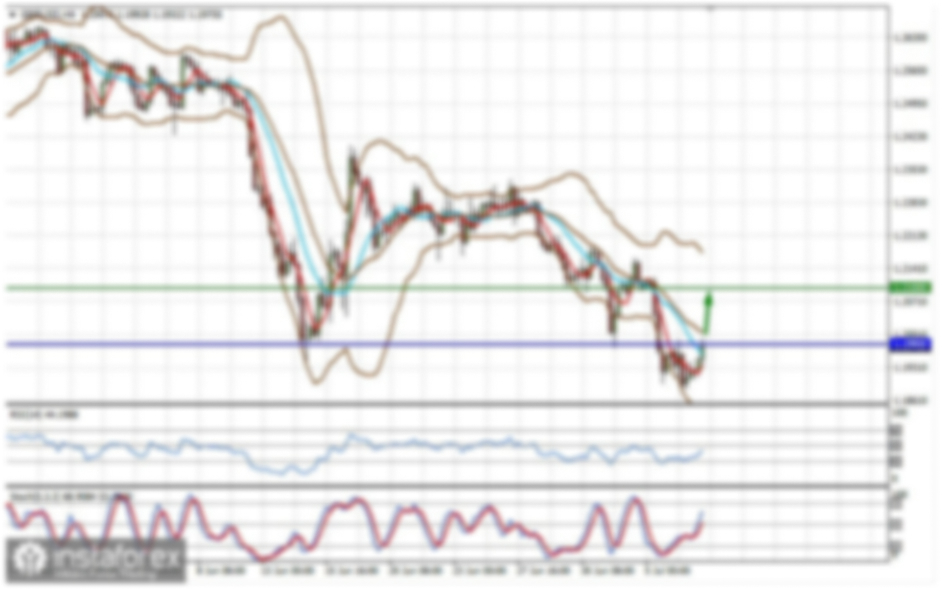
EUR/USD 1H
The euro/dollar pair resumed its upward movement on the hourly timeframe on February 25, despite the fact that it had settled below the rising channel a day earlier. Thus, the upward trend persists, and the signal regarding the exit from the channel turned out to be false. In general, the pair continues to move quite logically (unlike the pound/dollar pair), but this is more obvious in the long term. In the short term, as we can see, technical signals are not always correct. However, traders could still make money on this movement. In our last two articles, we advised you to buy the pair if a rebound from the Kijun-sen line occurs. Such a rebound happened, so traders could open long positions at around 1.2141. We gave the 1.2183 level as a target, so the profit on this is around 40 points. However, the EUR/USD pair did not spend much time around 1.2183 and 1.2190, and, since it immediately surpassed such, it just kept rising. We did not expect such a scenario, since volatility was not too high recently. However, traders had the right to open new long positions in order to overcome these levels. We regularly give signals for a breakout of one or another important level. Those who did this could have earned 40 more points. The most important thing from the previous day was a strong buy signal. The rebound from Kijun-sen was clear.
EUR/USD 15M
Both linear regression channels turned to the upside on the 15-minute timeframe. Thus, in the shortest term, the upward trend regained its relevance and strength. Since the quotes have come close to the important resistance level of 1.2249, a rebound from this level can provoke a downward movement. Overcoming it would sustain growth. The euro is moving more logically than the pound, so we are inclined to believe that there will be a round of correction today.
COT report
The EUR/USD pair rose by 70 points during the last reporting week (February 9-15). Volatility during this period of time was practically minimal. In the chart above, you can see that the pair, in principle, has not significantly decreased over the past weeks. We are constantly talking about a corrective January, but if you look at the chart, it becomes clear that this correction, compared to the entire 11-month upward trend, is simply nothing. A banal rollback. Thus, in general, we can conclude that market participants still do not favor the dollar and do not believe in it. Furthermore, the Commitment of Traders (COT) report from two weeks ago recorded a sharp drop in the number of Buy-contracts (longs) for the "non-commercial" group of traders. Then the net position of non-commercial traders dropped 33,000 contracts at once. It seems to be a good start for a downward trend, but the following week the COT report recorded an increase in the net position of major players, and the latest report that was released this Friday showed changes, albeit minimal, in favor of the bulls. That is, professional traders have taken up buying the euro once again. Around 2,500 new buy contracts were opened, as well as 1,300 Sell-contracts (shorts). The changes, respectively, are minimal and do not greatly affect the overall picture of the state of affairs. Thus, the overall picture remains in favor of the bulls, as more than 220,000 buy contracts and only 84,000 sell contracts remain open. The indicators below the chart clearly show that the trend is no longer becoming bearish. The green and red lines of the first indicator reflecting the net positions of the groups of traders "non-commercial" and "commercial" do not converge, therefore the current trend remains in effect.
The European Union did not publish a macroeconomic report and there wasn't any important fundamental event either. On the other hand, quite important figures were published in America, which finally caused at least some kind of market reaction. And as it turned out later, it was very strong, albeit with a delay. However, the reports were generally positive. For example, the GDP figure in the second estimate for the fourth quarter rose from 4.0% to 4.1%, which was broadly in line with forecasts. The index of orders for durable goods greatly exceeded the forecast values, and the data on applications for unemployment benefits turned out to be lower than expectations from experts and the markets. Thus, the dollar had the chance to slightly rise. But no.
No important events scheduled for Friday in the European Union, and only a few absolutely minor reports will be published in the United States. It is unlikely for traders to be impressed by reports on personal consumption expenditures or changes in personal income and expenditures of the American population, when they generally ignored yesterday's GDP report. Therefore, technique will remain in first place when making trading decisions.
We have two trading ideas for February 26:
1) Bulls continue to keep the initiative in their hands, even though the quotes have left the rising channel. Thus, we recommend opening new long positions while aiming for the resistance level of 1.2249 if the price rebounds from the Kijun-sen line (1.2166). Take Profit in this case can be up to 50 points.
2) Bears took the step towards a new downward trend, but they did not have enough strength. Thus, you can open short positions if the price settles below the Kijun-sen line (1.2166) while aiming for levels like 1.2145 and 1.2111. Take Profit in this case can be up to 50 points. It may also try to sell the pair if there is a clear rebound off the 1.2249 level. The target is 1.2190.
Forecast and trading signals for GBP/USD
Explanations for illustrations:
Support and Resistance Levels are the levels that serve as targets when buying or selling the pair. You can place Take Profit near these levels.
Kijun-sen and Senkou Span B lines are lines of the Ichimoku indicator transferred to the hourly timeframe from the 4-hour one.
Support and resistance areas are areas from which the price has repeatedly rebounded off.
Yellow lines are trend lines, trend channels and any other technical patterns.
Indicator 1 on the COT charts is the size of the net position of each category of traders.
Indicator 2 on the COT charts is the size of the net position for the "non-commercial" group.