empty
 
 
30.10.2023 11:05 AM
EUR/USD, GBP/USD: trading plan for beginners on October 30, 2023

Economic calendar on October 27, 2023:

Last Friday, the macroeconomic calendar was nearly empty. The only report worthy to note was US personal income and spending data.

Statistics details:

Personal Income (m/m) (Sep). Previous: 0.4%, Forecast: 0.4%, Actual: 0.3%

Personal Spending (m/m) (Sep). Previous: 0.4%, Forecast: 0.4%, Actual: 0.7%

Overview of trading charts for October 27, 2023

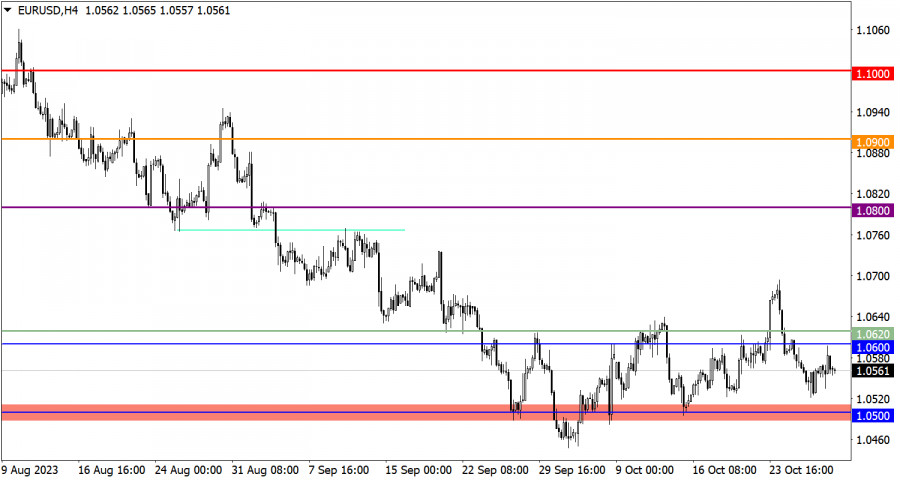
While moving upwards, the euro/dollar pair nearly reached the resistance level of 1.0600. Then the volume of long positions decreased, which allowed the greenback to pare some ground.

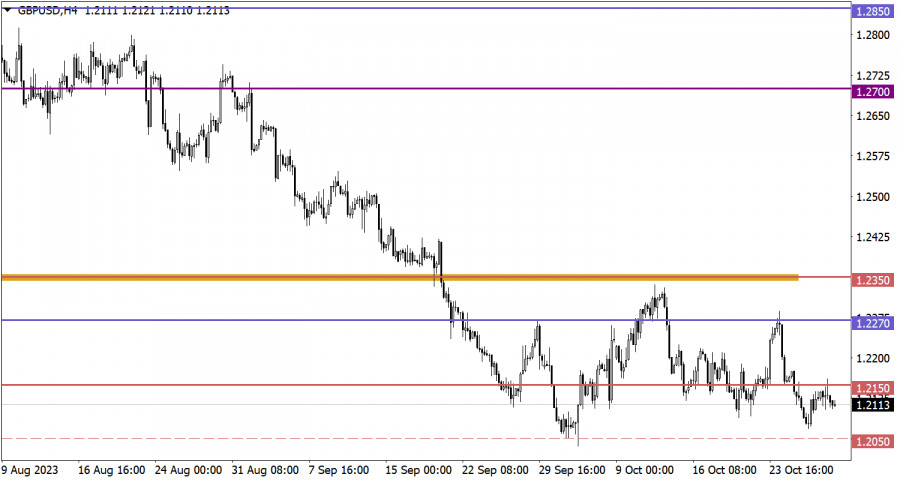
The pound/dollar pair traded in a local uptrend, but no dramatic changes occurred. The quote briefly surged to 1.2150 before reversing and losing value.

This image is no longer relevant

Economic calendar for October 30, 2023

Today's macroeconomic calendar is also bereft of any important news releases, except for UK lending market data.

EUR/USD trading plan for October 30, 2023

The euro/dollar pair is currently pulling back from the resistance level. In the case of a further increase in the volume of short positions, the euro might slide to the support level of 1.0500. However, if the dollar's current bullish run is short-lived and the quote consolidates above 1.0620, the market may move back to the upside.

This image is no longer relevant

GBP/USD trading plan for October 30, 2023

If the quote fails to consolidate above 1.2150, the pound sterling will lose value. A bear case scenario suggests a decline to the 1.2000/1.2150 area. However, if the quote stays firm above 1.2150, the British pound will most likely rise to the levels of 1.2200/1.2250.

This image is no longer relevant

What is shown on trading charts?

Candlestick charts are white and black graphic rectangles with lines above and below. While conducting a detailed analysis of each candlestick, you can notice its features intrinsic to a particular timeframe: the opening price, the closing price, as well as the highest and lowest prices;

Horizontal levels are price coordinates at which the price might pause or reverse. In the market, these levels are called support and resistance.

Circles and rectangles highlight examples where the price earlier reversed. This color highlighting points to horizontal lines that may influence the quote in the future.

Up/down arrows are indicators of possible future price directions.

Traders are recommended to read the following article:

EUR/USD and GBP/USD: Trading plan for beginner traders on October 27, 2023

รับผลกำไรจากการเปลี่ยนแปลงอัตราสกุลเงินดิจิทัลกับ InstaForex.
ดาวน์โหลด MetaTrader 4 และเปิดการซื้อขายครั้งแรกของคุณ.
  • Grand Choice
    Contest by
    InstaForex
    InstaForex always strives to help you
    fulfill your biggest dreams.
    เข้าร่วมการแข่งขัน
  • Chancy Deposit
    ฝากเงินในบัญชีของคุณใน $3,000 และรับ $5000 ไปเพิ่ม!
    ใน พฤศจิกายน ทางเราได้ออก$5000 ภายในแคมเปญ Chancy Deposit !
    คว้าโอกาสที่จะชนะด้วยการฝากเงิน $3,000 ไปในบัญชีเทรด เมื่อทำตามเงื่อนไขนี้แล้ว คุณก็จะกลายเป็นผู้เข้าร่วมแคมเปญ
    เข้าร่วมการแข่งขัน
  • เทรดให้ดีแล้วคว้ารางวัล
    เติมเงินในบัญชีของคุณอย่างน้อย $500 สมัครเข้าร่วมการแข่งขัน และลุ้นรับรางวัลอุปกรณ์ติดต่อสื่อสารแบบพกพา
    เข้าร่วมการแข่งขัน
  • โบนัส 100%
    โอกาสพิเศษของคุณในการรับโบนัส 100% จากเงินฝากของคุณ
    รับโบนัส
  • โบนัส 55%
    สมัครรับโบนัส 55% สำหรับการฝากทุกครั้ง
    รับโบนัส
  • โบนัส 30%
    รับโบนัส 30% ทุกครั้งที่คุณเติมเงินในบัญชีของคุณ
    รับโบนัส


บทความแนะนำ

หากไม่สะดวกคุยในตอนนี้
ระบุคำถามไว้ได้ใน แชท.
Widget callback