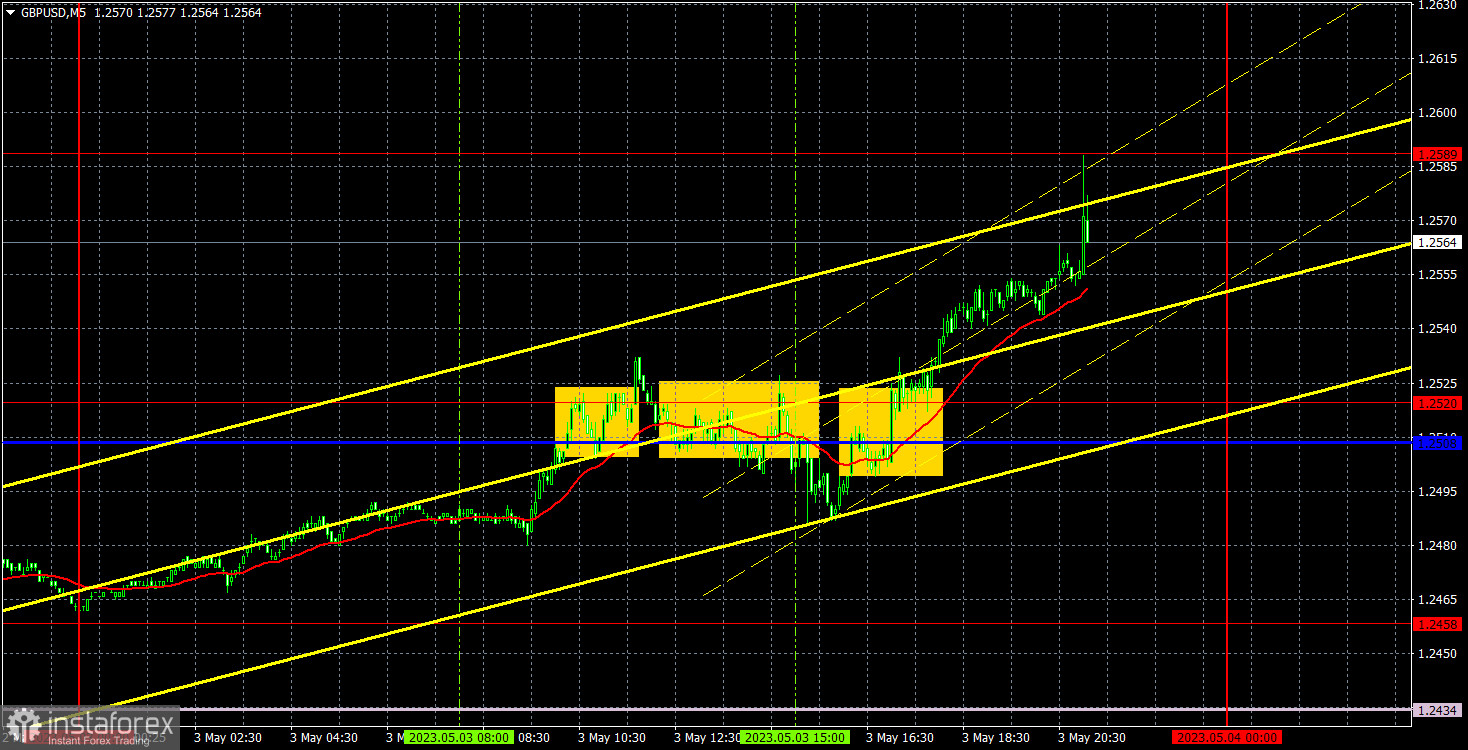
5M chart of GBP/USD
The GBP/USD pair traded in an unclear manner on Wednesday. For most of the day, the price was around the 1.2508-1.2520 area, forming several false signals. The most interesting movements occurred in the evening when traders could not trade intraday. The pair continues to show absolutely illogical movements, alternating between periods of flat, trend, and "swings." Yesterday's macroeconomic background was not reasonably worked out. Two US reports were stronger than forecasts, so they should have caused the dollar to rise. The Federal Reserve's decision to raise the rate by 0.25% should have triggered the dollar's growth. Especially since the dollar has been practically falling for the last 2 months. But there is still no logic in the movements, so we can only observe what is happening.
A total of three trading signals were formed throughout yesterday. First, the pair overcame the area mentioned above, then down, then up again. It was precisely the last third signal that could bring profit, but it should not have been worked out since the first two turned out to be false. The price couldn't pass 20 points in the right direction in both cases, so both trades resulted in a loss. Unfortunately, the day was quite unsuccessful, but these kinds of days are also an integral part of the overall trading process.
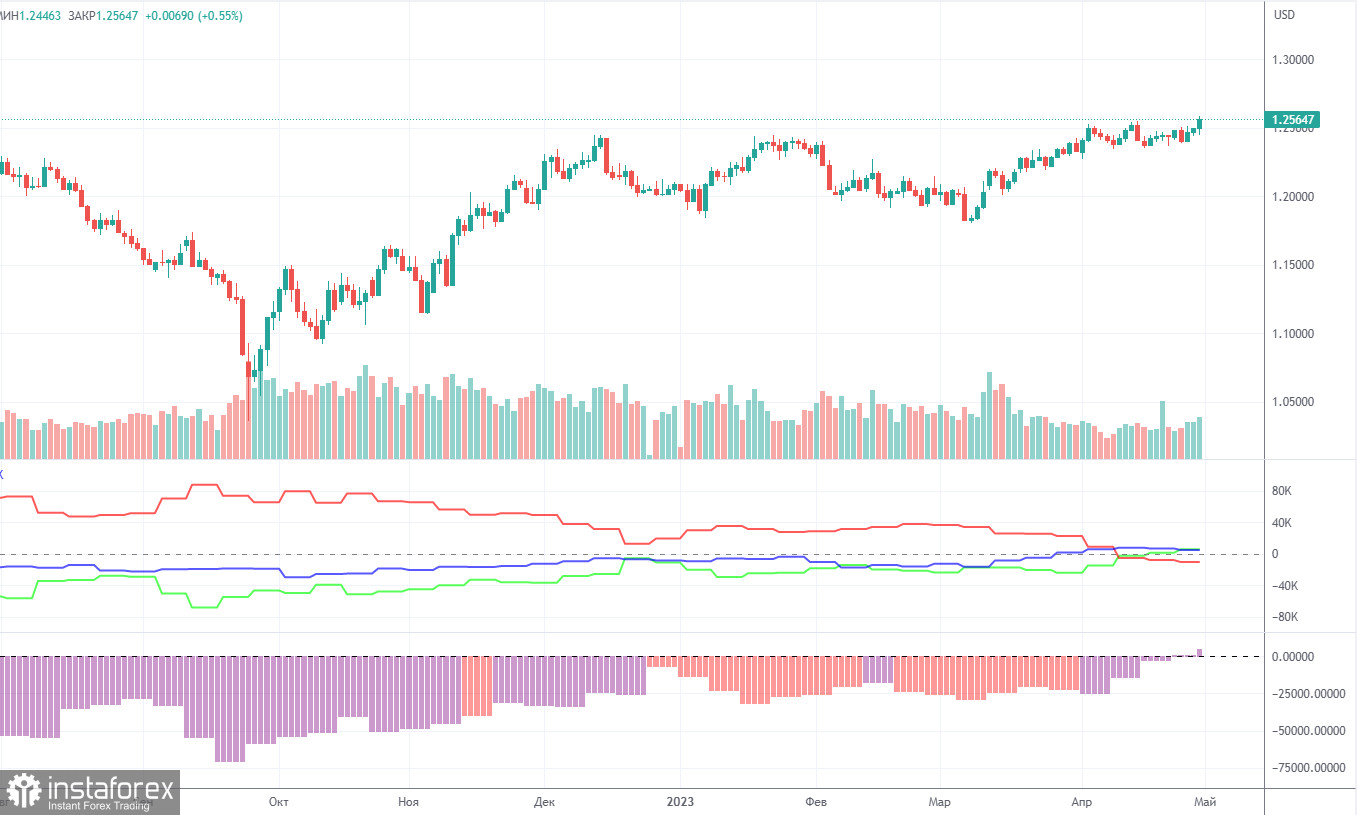
COT report:
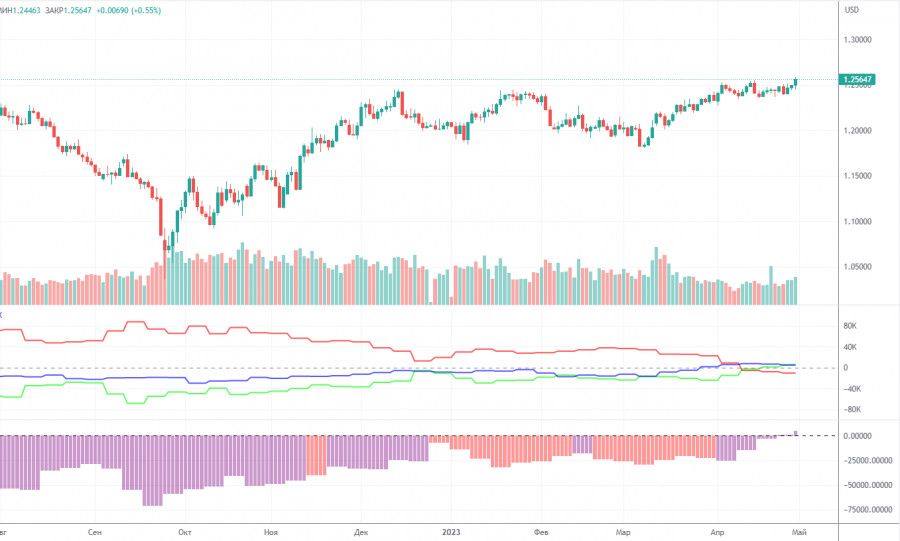
According to the latest COT report on the British pound, the non-commercial group of traders opened 5,600 long positions and 1,000 shorts. As a result, the net position of the non-commercial group traders has increased by 4,600 and continues to grow. The net position has been steadily rising for the past 8-9 months, but the sentiment of major market players remained bearish during this time. Now it can be called bullish to some extent. Although the British pound is strengthening against the US dollar in the medium term, it is hard to explain this behavior from the fundamental point of view. There is still the possibility of a sharp decline in the pound. Both major pairs are moving in a similar way now, but the net position of the euro is positive and even implies the imminent completion of the upward momentum, while for the pound, it still suggests further growth. The British currency has already risen by more than 2,100 points, which is a lot, and without a strong bearish correction, the continuation of growth would be absolutely illogical. The non-commercial group of traders currently has a total of 53,500 shorts and 59,500 longs. I remain skeptical about the long-term growth of the British currency and expect it to decline.
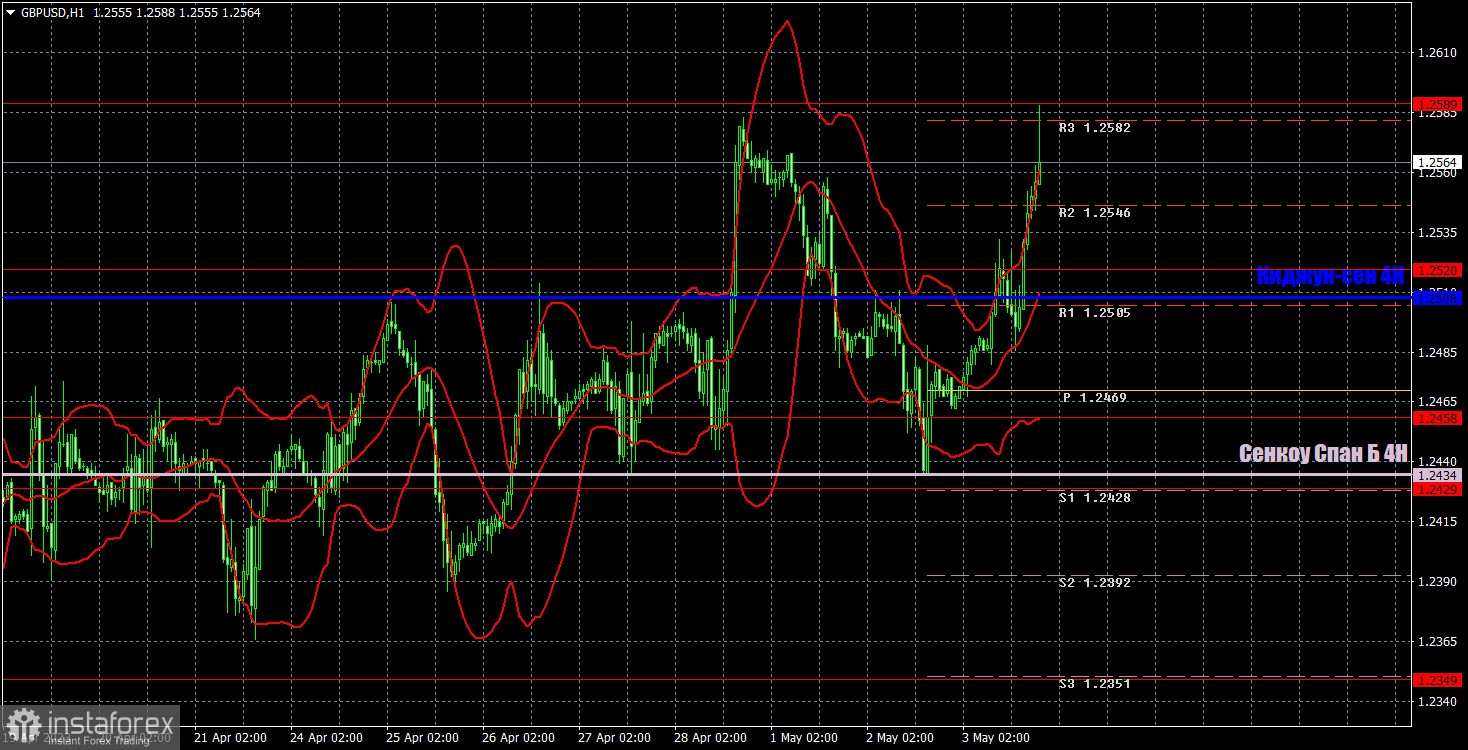
1H chart of GBP/USD
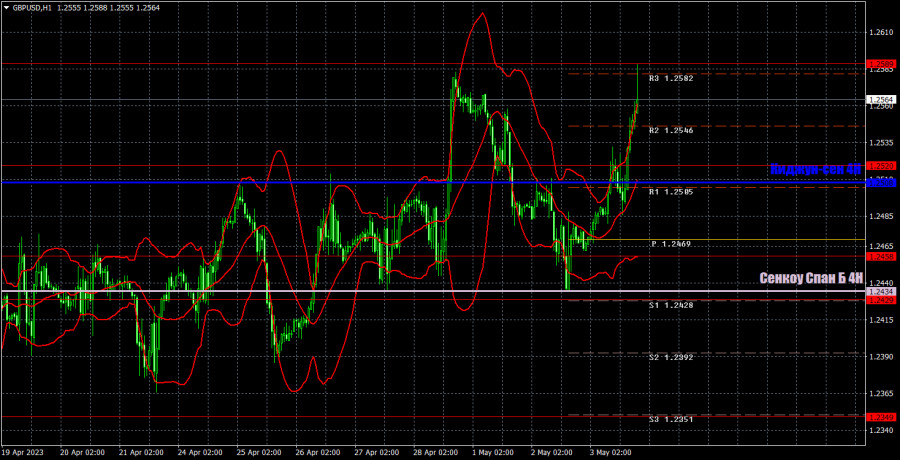
On the one-hour chart, the GBP/USD pair continues to ride on "swings" with a slight upward slope. The pound still could not show a significant drop after overcoming another ascending trendline. At this time, you can form the fourth ascending trendline, which doesn't mean anything since overcoming these lines still doesn't lead to a fall. In the short term, the pair continues to alternate between downward and upward spirals, ignoring all incoming information. For May 4, we highlight the following important levels: 1.2185, 1.2269, 1.2349, 1.2429-1.2458, 1.2520, 1.2589, 1.2659, 1.2762. Senkou Span B (1.2434) and Kijun-sen (1.2508) lines can also generate signals. Rebounds and breakouts from these lines can also serve as trading signals. It is better to set the Stop Loss at breakeven as soon as the price moves by 20 pips in the right direction. The lines of the Ichimoku indicator can change their position throughout the day which is worth keeping in mind when looking for trading signals. On the chart, you can also see support and resistance levels where you can take profit. On Thursday, the UK will only release its services PMI, and in the US, we only have a report on claims for unemployment benefits. I believe that the market can continue to work out the results of the Fed meeting in the morning, and after lunch - it will work out the results of the ECB meeting. The pound can also react to them. The euro may pull it up or down with it.
Indicators on charts:
Resistance/support - thick red lines, near which the trend may stop. They do not make trading signals.
Kijun-sen and Senkou Span B are the Ichimoku indicator lines moved to the hourly timeframe from the 4-hour timeframe. They are also strong lines.
Extreme levels are thin red lines, from which the price used to bounce earlier. They can produce trading signals.
Yellow lines are trend lines, trend channels, and any other technical patterns.
Indicator 1 on the COT chart is the size of the net position of each trader category.
Indicator 2 on the COT chart is the size of the net position for the Non-commercial group of traders.