Analysis of EUR/USD 5M
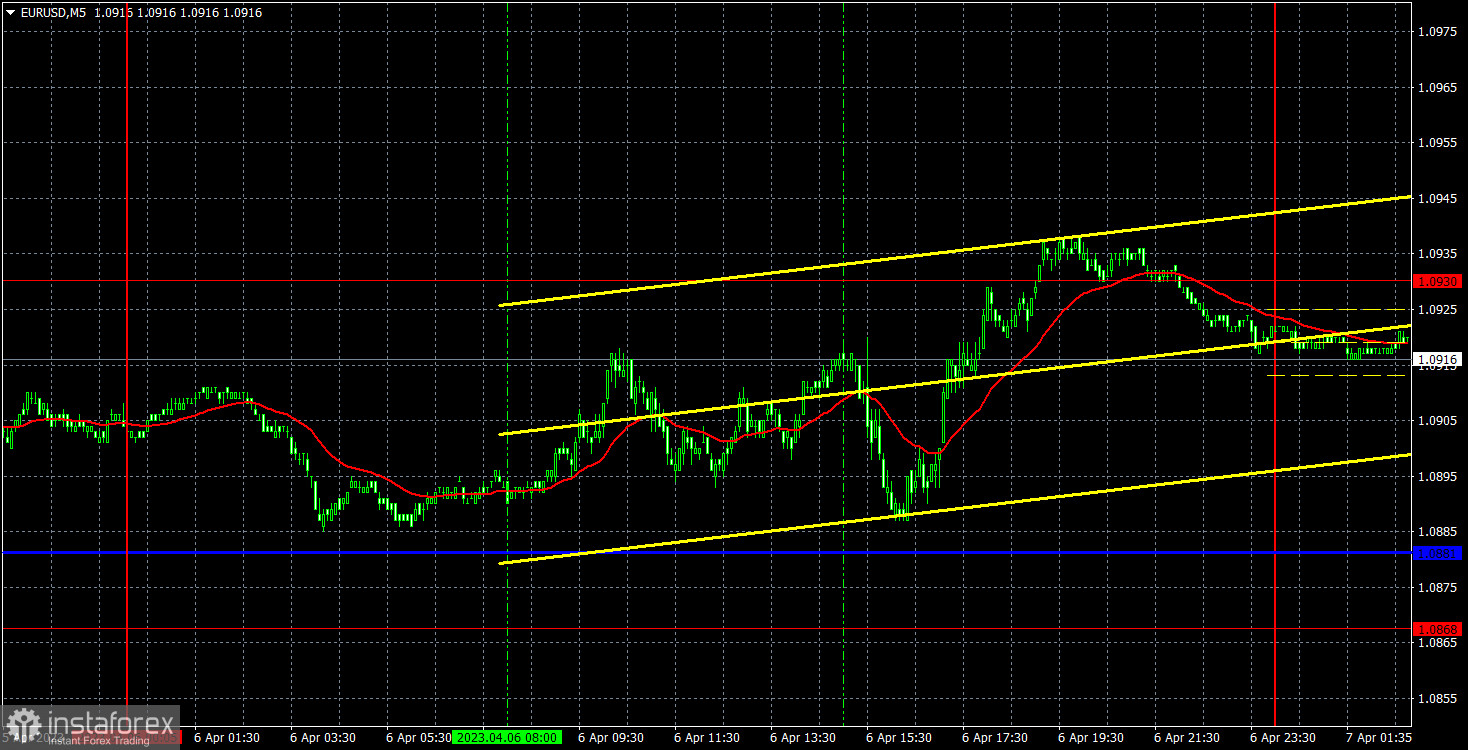
The currency pair EUR/USD traded mostly sideways during the fourth trading day of the week, with little upward or downward movement. Unsurprisingly, there was no macroeconomic news on this day, so the pair remained in a narrow price range for most of the day. Only towards the evening did the pair show some decent upward movement, although this "decent movement" amounted to a maximum of 50 points. Overall, the market was mostly stagnant throughout the day. It is worth noting that the pair's movements are currently very illogical and strange. In the two previous days, there was a minimal downward correction after several weeks of growth in the pair. Since there are few important events and reports this week, the lowered volatility and weak intraday trends do not raise any questions. The euro currency still cannot show strong downward movement and remains very high. Today is an important day, but we fear that the market's reaction to data on the US labor market and unemployment will be illogical.
As for trading signals, none were formed yesterday. The pair approached the critical line several times during the day, but each time it only reached it by 5 points, which is too large an error to act on such a signal. Since movements on Thursday were not the best, it is even better that there were no trading signals.
COT report:
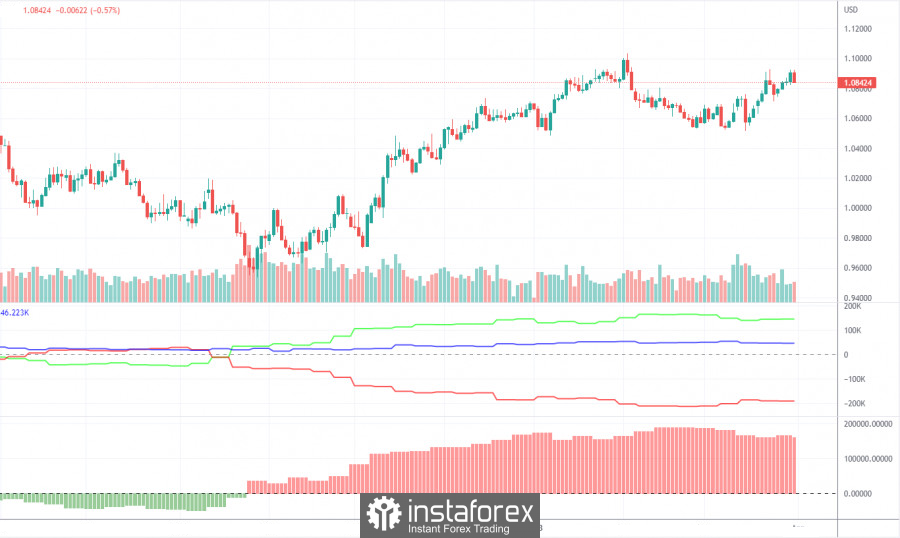
On Friday, a new COT report was released for March 28. The CFTC has caught up with lost time and is now publishing reports corresponding to the current period. Over the past few months, the picture has fully corresponded to what is happening in the market. As shown in the chart above, the net position of large traders (the second indicator) has risen since September 2022. At approximately the same time, the European currency also began to rise. At the moment, non-commercial traders have a net position that is still very bullish, and positions in the European currency can't properly correct down. We have already drawn traders' attention to the fact that a fairly high value of the "net position" allows for the possibility of the soon ending of the upward trend. The first indicator, which frequently occurs before the end of a trend and on which the red and green lines have moved far apart from one another, indicates this. The European currency has tried to start falling, but for now, it is just a simple pullback. During the last reporting week, the number of buy contracts for the "non-commercial" group increased by 7.1 thousand, while the number of shorts increased by 6.9 thousand. Consequently, the net position remained virtually unchanged. The number of buy contracts exceeds the number of sell contracts among non-commercial traders by 145 thousand. A correction is still brewing, so even without the COT reports, it is clear that the pair should resume its decline.
EUR/USD 1H analysis.

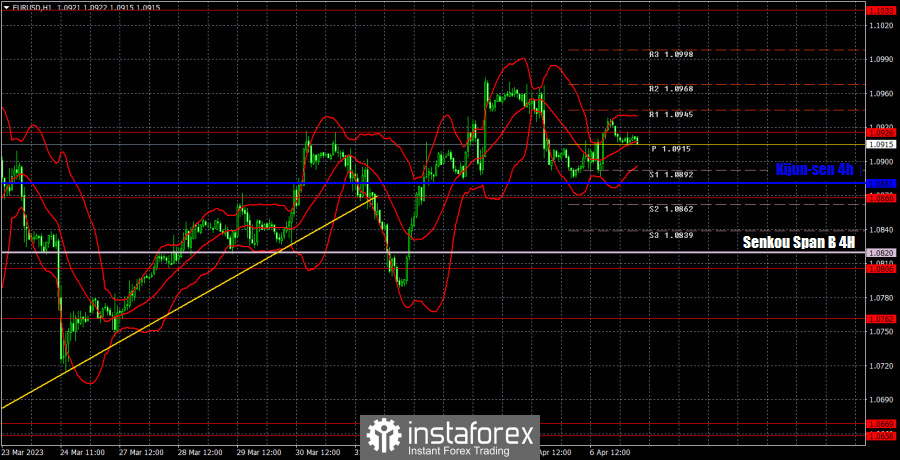
On the hourly timeframe, the pair maintains an upward trend without a new trend line. The rise of the European currency can resume anytime, even without sufficient grounds. Only a price fix below the Ichimoku indicator lines will allow us to consider starting a downward trend on the hourly timeframe. Still, even with the critical line overcome, serious difficulties arise. Traders still desperately do not want to sell. On Friday, we highlight the following levels for trading: 1.0581, 1.0658-1.0669, 1.0762, 1.0806, 1.0868, 1.0930, 1.1033, 1.1137-1.1185, 1.1234, 1.1274, as well as the Senkou Span B line (1.0820) and the Kijun-sen line (1.0881). The Ichimoku indicator lines can move during the day, which should be considered when determining trading signals. There are also auxiliary support and resistance levels, but signals are not forming around them. Signals can be "bounces" and "breakouts" of extreme levels and lines. Do not forget to set a Stop Loss order at break-even if the price has moved in the right direction by 15 points. This will protect against possible losses if the signal turns out to be false. On April 7, no important events are planned in the European Union, but in the United States, the most important data on unemployment and Non-Farm Payrolls will be published. Thus, in the second half of the day, the pair may show volatile movements, but they are unlikely to be logical.
Explanation of the illustrations:
Support and resistance levels are thick red lines around which movement may end. They are not sources of trading signals.
The Kijun-sen and Senkou Span B lines are Ichimoku indicator lines transferred to the hourly timeframe from the 4-hour timeframe. They are strong lines.
Extreme levels are thin red lines from which the price has bounced before. They are sources of trading signals.
Yellow lines are trend lines, channels, and other technical patterns.
Indicator 1 on the COT charts is the size of the net position for each category of traders.
Indicator 2 on the COT charts is the size of the net position for the "non-commercial" group.