empty
 
 
27.03.2023 01:02 PM
Technical analysis of EUR/USD and GBP/USD on March 27

EUR/USD

This image is no longer relevant

Larger timeframes

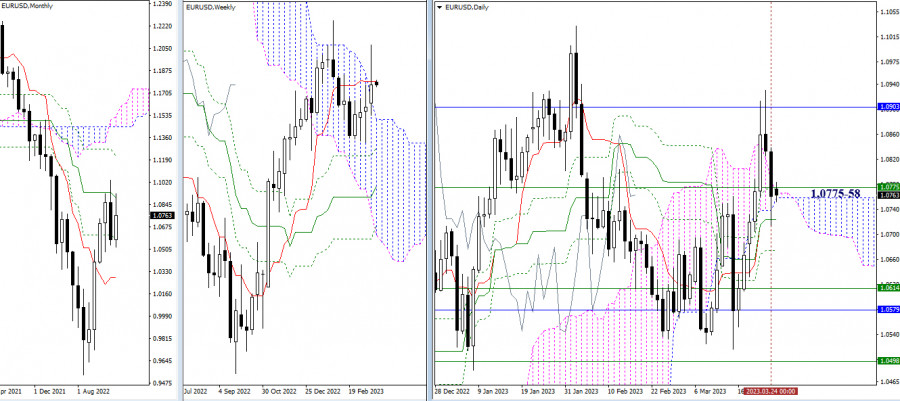
Last week, the euro bulls cast a long shadow into the bullish zone relative to an intraday and one-week Ichimoku clouds, having tested 1.09101, the resistance of a one-month medium-term trend. However, they failed to settle at the highs attained. The currency pair closed last trading week lower than the one-week short-term trend line of 1.0775 and returned to the daily cloud. As a result, the support zone is currently clustered between the daily cloud of 1.0758 and the one-week cloud of a short-term trend at 1.0775. Later today, if the bears don't try to terminate the daily Ichimoku cloud, they will have to settle below 1.0724-1.0675, the support area of the cross.

This image is no longer relevant

H4 – H1

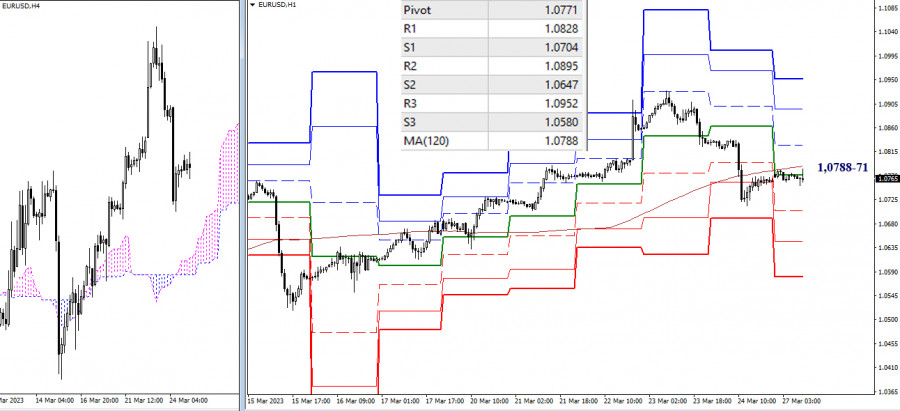
On smaller time frames, EUR/USD dipped below the critical levels so that the bears are regaining the upper hand in the market. Still, the bears lack the energy to leave the support area. If they manage to drag the price down, the support levels of classic pivot levels (1.0704 – 1.0647 – 1.0580) will serve as the downward intraday targets. If the bulls are able to seize the key level (the central pivot level of 1.0771 + the one-week long-term trend line of 1.0788), the ongoing balance of trading forces will shift in the bulls' favor. The bullish intraday targets could be set at 1.0828 – 1.0895 – 1.0952 which coincide with resistance levels of classic pivot levels.

***

GBP/USD

This image is no longer relevant

Larger timeframes

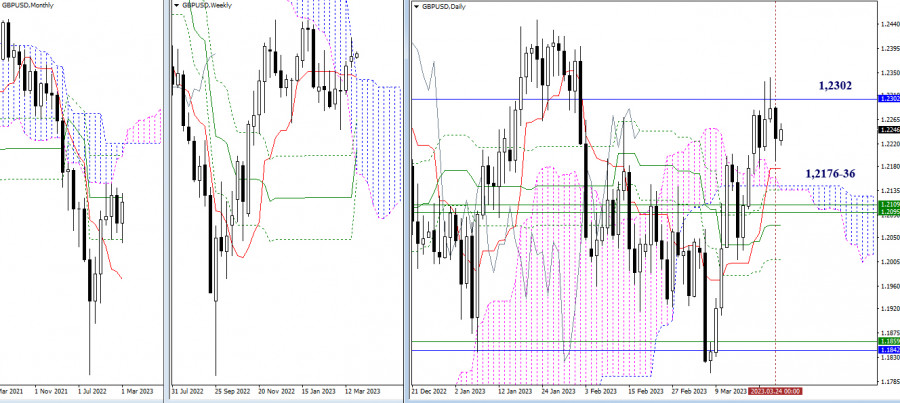
Last week, GBP/USD tested the one-month medium-term trend line at 1.2302. The price didn't break this level or at least, didn't close higher. Therefore, this level remains the basic resistance of this section. The next target for the bulls is seen at a higher level than a one-year high of 1.2447. The support zone is still wide and secured. It can be divided into three main areas: 1.2176 – 1.2136 (the daily cloud + levels of the daily cross), 1.2109 – 1.2095 – 1.2072 (one-week levels + daily medium-tern trend), and 1.2008 (the final level of the daily Ichimoku cross).

This image is no longer relevant

H4 – H1

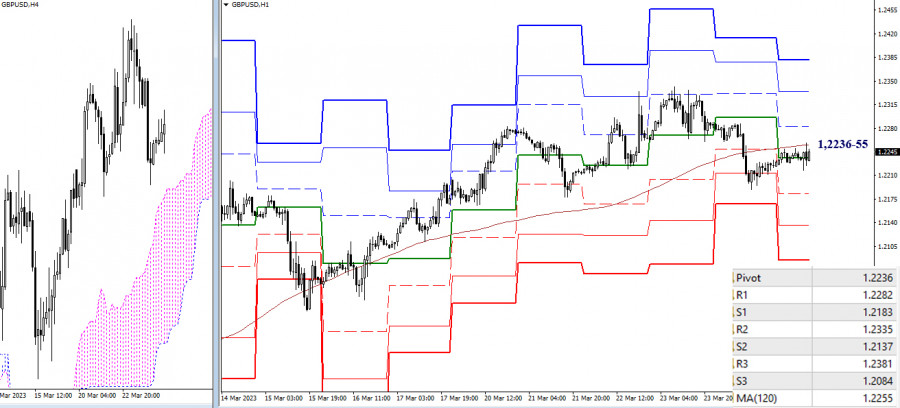
At the moment of analysis, the outlook for GBP/USD is uncertain. The instrument is connected to the zone of key levels which are combined today at 1.2236-55 (the central pivot level + one-week long-term trend line). Later on the trading day, the classic pivot levels will come into play because the bulls are interested in resistance levels of 1.2282 – 1.2335 – 1.2381, whereas the bears are interested in support levels of 1.2183 – 1.2137 – 1.2084.

***

This technical analysis is based on the following ideas:

Larger timeframes - Ichimoku Kinko Hyo (9.26.52) + Fibo Kijun levels

Smaller timeframes - H1 – classic pivot points + 120-period Moving Average (weekly long-term trend line)

รับผลกำไรจากการเปลี่ยนแปลงอัตราสกุลเงินดิจิทัลกับ InstaForex.
ดาวน์โหลด MetaTrader 4 และเปิดการซื้อขายครั้งแรกของคุณ.
  • Grand Choice
    Contest by
    InstaForex
    InstaForex always strives to help you
    fulfill your biggest dreams.
    เข้าร่วมการแข่งขัน
  • Chancy Deposit
    ฝากเงินในบัญชีของคุณใน $3,000 และรับ $5000 ไปเพิ่ม!
    ใน พฤศจิกายน ทางเราได้ออก$5000 ภายในแคมเปญ Chancy Deposit !
    คว้าโอกาสที่จะชนะด้วยการฝากเงิน $3,000 ไปในบัญชีเทรด เมื่อทำตามเงื่อนไขนี้แล้ว คุณก็จะกลายเป็นผู้เข้าร่วมแคมเปญ
    เข้าร่วมการแข่งขัน
  • เทรดให้ดีแล้วคว้ารางวัล
    เติมเงินในบัญชีของคุณอย่างน้อย $500 สมัครเข้าร่วมการแข่งขัน และลุ้นรับรางวัลอุปกรณ์ติดต่อสื่อสารแบบพกพา
    เข้าร่วมการแข่งขัน
  • โบนัส 100%
    โอกาสพิเศษของคุณในการรับโบนัส 100% จากเงินฝากของคุณ
    รับโบนัส
  • โบนัส 55%
    สมัครรับโบนัส 55% สำหรับการฝากทุกครั้ง
    รับโบนัส
  • โบนัส 30%
    รับโบนัส 30% ทุกครั้งที่คุณเติมเงินในบัญชีของคุณ
    รับโบนัส


บทความแนะนำ

หากไม่สะดวกคุยในตอนนี้
ระบุคำถามไว้ได้ใน แชท.
Widget callback