Details of the economic calendar on March 1
UK mortgage approvals in January came out at 40,000, up from 36,000 the previous month, according to a report from the Bank of England. The actual data came out better than the estimated figure of 37,000. Likewise, the volume of consumer lending also turned out to be better than predicted.
The final index of business activity in the manufacturing sector of the Eurozone, the United Kingdom, and the United States was released.
Details of PMI statistics:
Eurozone manufacturing PMI fell from 48.8 to 48.5 in February, which coincided the preliminary estimate.
United Kingdom manufacturing PMI rose to 49.3 from 49.2, compared to a forecast of 49.2. The change is insignificant with the preliminary estimate.
United States manufacturing PMI rose from 46.9 to 47.3. The final data was slightly worse than the preliminary estimate, which estimated the growth to 47.8.
Yesterday, Bank of England Governor Andrew Bailey gave a speech in which he described the general economic situation in the country. Although he used conventional wording in most of his remarks, he noticeably stressed at the end of the speech that the decision on further interest rate hikes has not been finalized. Note that Bailey presented a new inflation forecast, which can be characterized as very optimistic. According to the forecast, inflation should fall below 4.0% by the end of this year. Based on this, we can conclude the possibility of stopping the growth of interest rates, as well as their reduction. This probably caused the weakening of the British currency as the interest rate policy of the Bank of England might change soon.
Analysis of trading charts from March 1
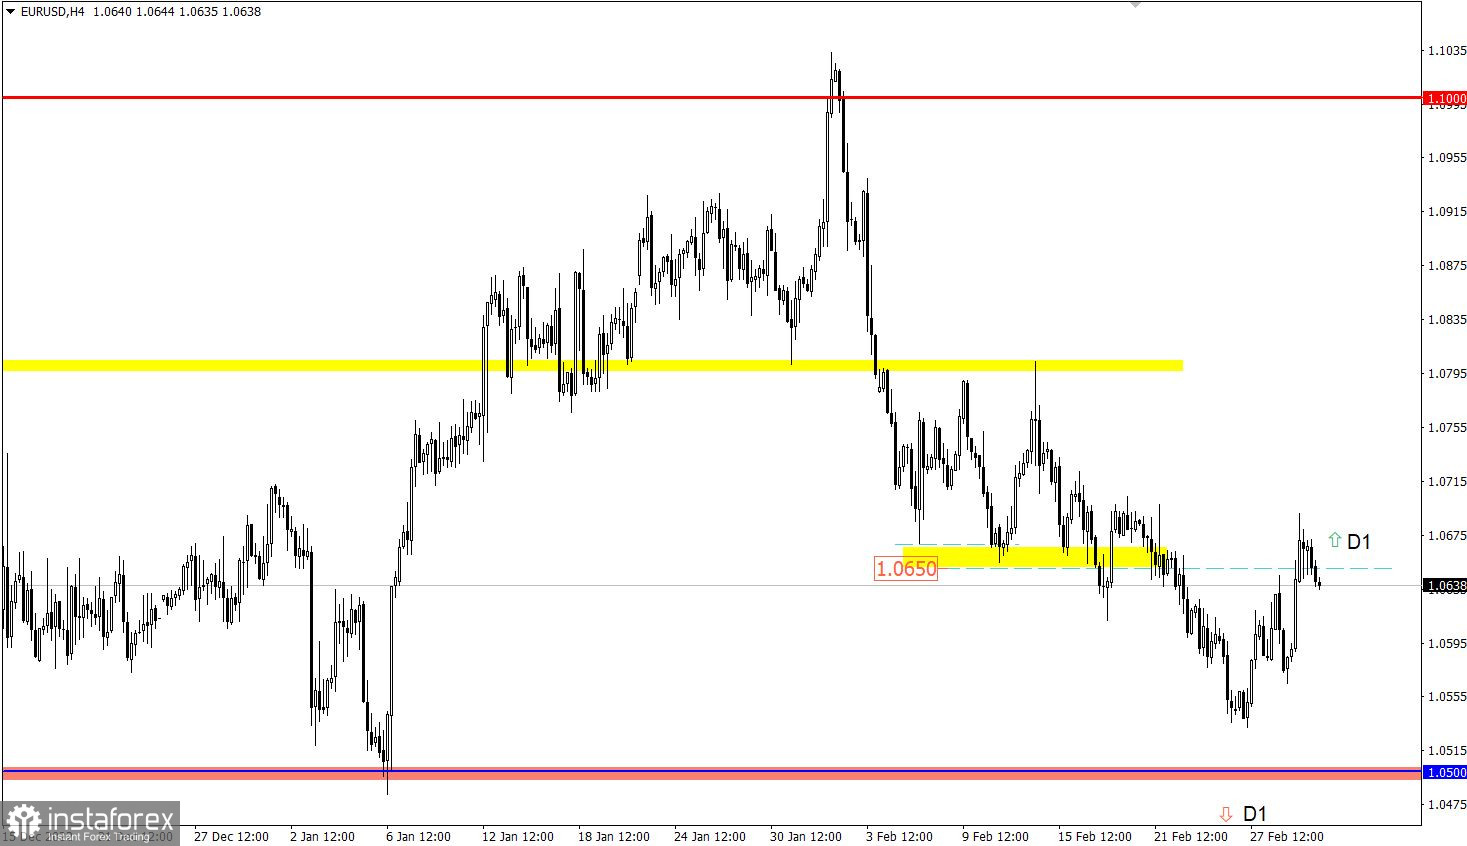
EURUSD temporarily rose above 1.0650 but could not hold on to new values and began to decline. This led to a reduction in the volume of long positions in the euro and a pullback of the quote. Note that the depreciation of the euro could be caused by a positive correlation with the pound sterling, which yesterday showed a downward trend during the American trading session.
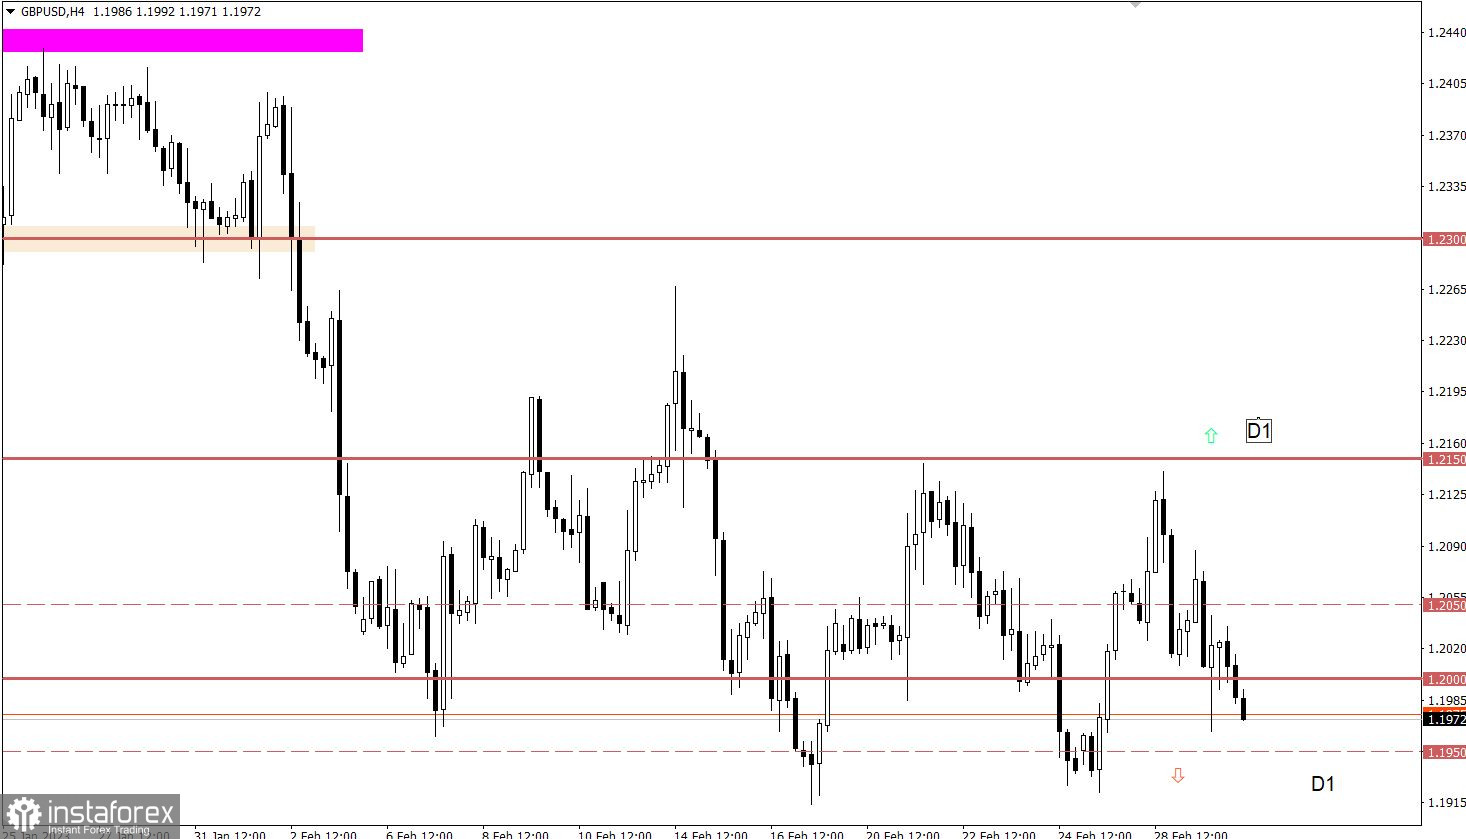
GBPUSD showed speculative activity, when the quote rose above 1.2050 and then returned below 1.2000. Despite closing the trading day with the Doji candlestick pattern, the downward trend continues in the market.
Economic calendar for March 2
Today's main event is the release of inflation data in the EU, which will help clarify expectations regarding the actions of the regulator at the next meeting. The inflation rate is estimated to decline from 8.6% to 8.2% in annual terms.
A strong decline in inflation could indicate a change in ECB policy going forward, which could contribute to a weaker euro as interest rate hikes may slow down.
Time targeting:
EU inflation – 10:00 UTC
EUR/USD trading plan for March 2
At the moment, the process of restoring the euro has stopped, but the situation may change if the quote continues to hold above 1.0650. This will lead to a new increase in the volume of long positions and, consequently, to an increase in the euro exchange rate. As an alternative scenario, the price rebound from 1.0650 is considered, which will serve as a resistance and may lead to the continuation of the downward cycle.
GBP/USD trading plan for March 2
The price movement along the 1.2000 psychological level for more than two weeks indicates the typical interaction of trading forces at this level, which led to the formation of a side channel between the levels of 1.1950 and 1.2150.
In order for technical signals about the end of the flat to appear, the quote must stay outside one of these boundaries during the day. As long as the movement is within the specified limits, it will remain in the market.
What's on the charts
The candlestick chart type is white and black graphic rectangles with lines above and below. With a detailed analysis of each individual candle, you can see its characteristics relative to a particular time frame: opening price, closing price, intraday high and low.
Horizontal levels are price coordinates, relative to which a price may stop or reverse its trajectory. In the market, these levels are called support and resistance.
Circles and rectangles are highlighted examples where the price reversed in history. This color highlighting indicates horizontal lines that may put pressure on the asset's price in the future.
The up/down arrows are landmarks of the possible price direction in the future.