empty
19.01.2023 07:40 AM
Outlook and trading signals for EUR/USD on January 19. COT report. Analysis of market situation. US reports were weak, but the market did not pay attention to them.

M5 chart of EUR/USD

This image is no longer relevant

EUR/USD tried to cross 1.0868 on Wednesday twice, but by the end of the day it still moved away from this mark. If we weren't already used to the fact that the euro could rise by more than 1000 pips over the past months, we would say that the market is now in a flat. The pair has been between 1.0780 and 1.0868 for several days. But it might be just the calm before the euro surges. Do recall that the euro is desperately unwilling to correct, and only takes pauses from time to time. Yesterday the EU published a totally uninteresting inflation report. "Uninteresting" because it was the second estimate of the indicator for December, and it was not at all different from the first. Moreover, inflation fell quite noticeably, by 0.9%, which could in no way provoke a rise in the euro in the first half of the day. The euro was already falling even more during the US session, though the US reports were also weak.

Despite the unusual behavior, Wednesday's trading signals were actually quite good. The first buy signal was not formed at the beginning of the movement, near 1.0806. After that the price managed to rise to 1.0868 and rebound from it, which was exactly ideal. The profit is 40 pips. The rebound from 1.0868 should have been used to open a short position, but the price failed to reach 1.0806, so this trade was closed with a Stop Loss at breakeven. Then followed a buy signal around 1.0868, which turned out to be false, the loss was 20 pips. And the last sell signal near the same level brought traders the profit of about 60 pips, as the price dropped below the critical line. In general, the day was very successful.

COT report

This image is no longer relevant

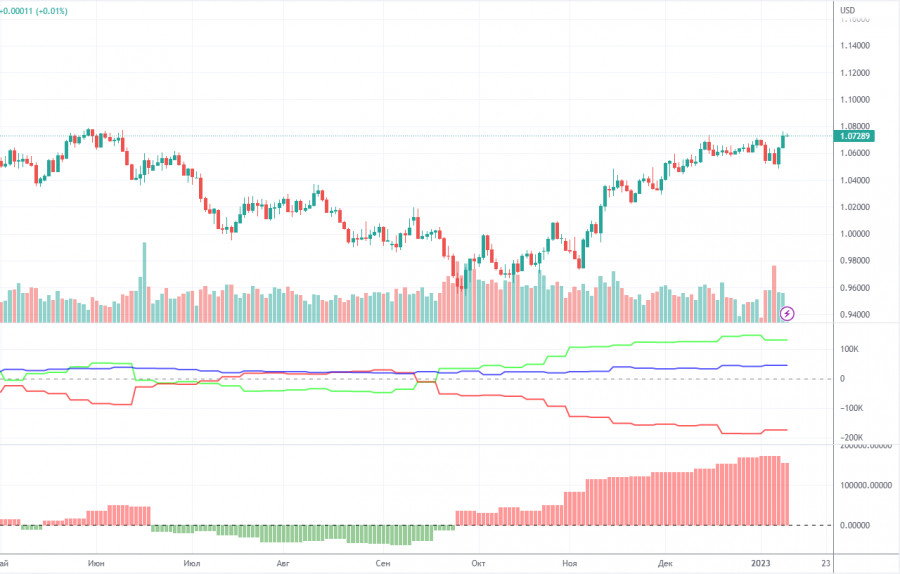
The COT reports for the euro in the last few months have been fully consistent with what is happening in the market. You can clearly see on the chart that the net position of big players (the second indicator) has been growing since early September. Around the same time, the euro started to grow. At this time, the net position of the non-commercial traders has been bullish and strengthens almost every week, but it is a rather high value that allows us to assume that the upward movement will end soon. Notably, the green and red lines of the first indicator have moved far apart from each other, which often means the end of the trend. During the given period, the number of long positions held by non-commercial traders increased by 16,000, whereas the number of short positions rose by 11,000. Thus, the net positions increased by 5,000. The number of long positions is 135,000 higher than the number of short positions opened by non-commercial traders. So the question now is how long will the big players increase their longs? Moreover, from a technical perspective, a bearish correction should have started a long time ago. In my opinion, this process can not continue for another 2 or 3 months. Even the net position indicator shows that we need to "unload" a bit, that is, to correct. The overall number of short orders exceeds the number of long orders by 48,000 (702,000 vs. 655,000).

H1 chart of EUR/USD

This image is no longer relevant

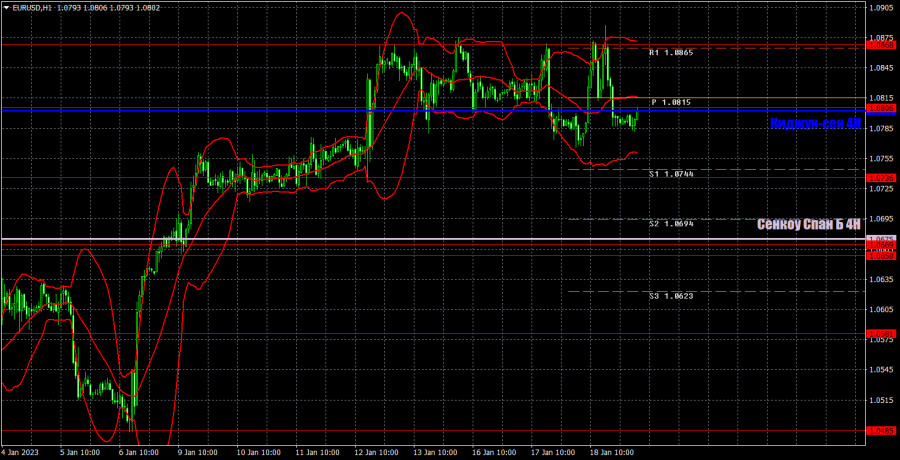
You can see on the one-hour chart that EUR/USD has a chance to move down. Crossing the critical line is quite an important signal, unless the price manages to rise above it today. This is a possibility, because lately the pair's movement seems more like a flat. On Thursday, the pair may trade at the following levels: 1.0658-1.0669, 1.0736, 1.0806, 1.0868, 1.0938, 1.1036, 1.1137 and also Senkou Span B (1.0675) and Kijun Sen (1.0802) . Lines of the Ichimoku indicator may move during the day, which should be taken into account when determining trading signals. There are also support and resistance levels, but signals are not formed near these levels. Bounces and breakouts of the extreme levels and lines could act as signals. Don't forget about stop-loss orders, if the price covers 15 pips in the right direction. This will prevent you from losses in case of a false signal. On January 19, European Central Bank President Christine Lagarde will give a speech in the EU, which might be interesting. Then there are just minor reports and a few speeches from the Federal Reserve in the US.

What we see on the trading charts:

Price levels of support and resistance are thick red lines, near which the movement may end. They do not provide trading signals.

The Kijun-sen and Senkou Span B lines are the lines of the Ichimoku indicator, moved to the one-hour chart from the 4-hour one. They are strong lines.

Extreme levels are thin red lines from which the price bounced earlier. They provide trading signals.

Yellow lines are trend lines, trend channels, and any other technical patterns.

Indicator 1 on the COT charts reflects the net position size of each category of traders.

Indicator 2 on the COT charts reflects the net position size for the non-commercial group.

Paolo Greco,
ผู้เชี่ยวชาญด้านการวิเคราะห์ของ InstaForex
© 2007-2025
เลือกช่วงเวลา
5
นาที
15
นาที
30
นาที
1
ชั่วโมง
4
ชั่วโมง
1
วัน
1
สัปดาห์
รับผลกำไรจากการเปลี่ยนแปลงอัตราสกุลเงินดิจิทัลกับ InstaForex.
ดาวน์โหลด MetaTrader 4 และเปิดการซื้อขายครั้งแรกของคุณ.
USD/JPY: เคล็ดลับการเทรดง่าย ๆ สำหรับนักเทรดมือใหม่ - 17 มีนาคม (ช่วงการซื้อขายในสหรัฐอเมริกา) การทดสอบที่ระดับ 148.68 เกิดขึ้นเมื่อดัชนี MACD เคลื่อนตัวลงต่ำอย่างมากจากจุดศูนย์ ซึ่งจำกัดศักยภาพในการลดลงของคู่เงินนี้ ด้วยเหตุนี้ ฉันจึงไม่ขายดอลลาร์และไม่เข้าตลาด ต่อมาวันนี้ จะมีการมุ่งเน้นไปที่ข้อมูลการขายปลีกของสหรัฐฯ ซึ่งเป็นตัวบ่งชี้ที่สำคัญต่อสุขภาพของเศรษฐกิจสหรัฐฯ นักลงทุนและนักวิเคราะห์จะติดตามตัวเลขเหล่านี้อย่างใกล้ชิด เพราะกิจกรรมของผู้บริโภคคือแรงขับเคลื่อนหลักของการเติบโตทางเศรษฐกิจ หากการขายปลีกเพิ่มขึ้น อาจสนับสนุนดอลลาร์สหรัฐฯ
  • Grand Choice
    Contest by
    InstaForex
    InstaForex always strives to help you
    fulfill your biggest dreams.
    เข้าร่วมการแข่งขัน


บทความแนะนำ

GBP/USD: แผนการซื้อขายสำหรับรอบการซื้อขายของสหรัฐฯ ในวันที่ 17 มีนาคม (รีวิวการซื้อขายช่วงเช้า)

ในคำทำนายเมื่อเช้าที่ผ่านมา ฉันได้เน้นย้ำ 1.2949 เป็นระดับสำคัญสำหรับการตัดสินใจเข้าตลาด ลองมาวิเคราะห์กราฟ 5 นาทีเพื่อดูว่าเกิดอะไรขึ้น ราคาขยับสูงขึ้น แต่การทดสอบกลับของ 1.2949 ไม่เกิดขึ้น ทำให้ฉันพลาดโอกาสในการซื้อขายไป มุมมองทางเทคนิคได้ถูกปรับสำหรับช่วงครึ่งหลังของวัน การเปิดสถานะ Long

Miroslaw Bawulski 17:20 2025-03-17 UTC+2

EUR/USD: แผนการซื้อขายสำหรับช่วงตลาดสหรัฐฯ ในวันที่ 17 มีนาคม (รีวิวการซื้อขายรอบเช้า)

ในพยากรณ์เช้าของฉัน ฉันเน้นที่ระดับ 1.0866 เป็นจุดสำคัญในการตัดสินใจเข้าซื้อขาย มาดูแผนภูมิ 5 นาทีเพื่อวิเคราะห์สิ่งที่เกิดขึ้น การลดลงนั้นเกิดขึ้นจริง แต่ราคาลดลงไม่ถึงระดับและขาดไปเพียงไม่กี่จุด ทำให้ฉันไม่มีจุดเข้าซื้อขายที่เหมาะสม มุมมองทางเทคนิคสำหรับครึ่งหลังของวันนี้ยังคงไม่เปลี่ยนแปลง การเปิดสถานะ Long บน EUR/USD

Miroslaw Bawulski 17:17 2025-03-17 UTC+2

คำแนะนำการซื้อขายและการวิเคราะห์สำหรับ GBP/USD ในวันที่ 17 มีนาคม: เงินปอนด์แสดงท่าทีไม่สนใจต่อเศรษฐกิจ

คู่เงิน GBP/USD มีการลดลงเล็กน้อยในวันศุกร์ที่ผ่านมา โดยมีความผันผวนต่ำ ในความเป็นจริง ค่าเงินปอนด์ของสหราชอาณาจักรลดลงต่อเนื่องเป็นเวลาสามวันติดต่อกัน โดยสูญเสียรวม 50 pips ในเวลาเดียวกัน ในกรอบเวลารายชั่วโมง ราคาไม่สามารถยืนต่ำกว่าระดับเส้นสำคัญได้ หลังจากช่วงของการเติบโตอย่างแข็งแกร่ง ปัจจุบันยังไม่มีสัญญาณบ่งชี้การเริ่มต้นของการปรับฐาน ถึงแม้ว่ารายงาน

Paolo Greco 02:54 2025-03-17 UTC+2

ข้อเสนอแนะและการวิเคราะห์การซื้อขาย EUR/USD ประจำวันที่ 17 มีนาคม: ยูโรยังคงมั่นคงที่จุดสูงสุด

คู่สกุลเงิน EUR/USD มีการซื้อขายเพิ่มขึ้นในวันศุกร์อีกครั้ง แม้ว่าไม่มีเหตุผลที่ชัดเจนสำหรับการเคลื่อนไหวนี้ การเพิ่มขึ้นเกิดขึ้นในช่วงการซื้อขายในยุโรป และตามมาด้วยช่วงเวลาที่การซื้อขายเคลื่อนไหวไปในแนวข้างเป็นส่วนใหญ่จนถึงสิ้นวัน ตลาดตอบสนองต่อรายงานดัชนีราคาผู้บริโภคที่เป็นกลางของเยอรมนีหรือดัชนีความเชื่อมั่นของผู้บริโภคจากสหรัฐฯ หรือไม่? ไม่จำเป็นเสมอไป. ประการแรก การเพิ่มขึ้นของเงินยูโรเริ่มขึ้นหลังจากที่ข้อมูลเงินเฟ้อในสหภาพยุโรปได้ประกาศออกมามาแล้ว ประการที่สอง รายงานดังกล่าวไม่มีความสำคัญเพียงพอที่กระตุ้นให้ตลาดตอบสนองอย่างแรง ประการที่สาม คู่สกุลเงินนี้มีการซื้อขายอยู่ในกรอบราคาที่จำกัด

Paolo Greco 02:54 2025-03-17 UTC+2

วิธีการเทรดคู่สกุลเงิน GBP/USD ในวันที่ 17 มีนาคม? เคล็ดลับและการวิเคราะห์การเทรดง่ายๆ สำหรับมือใหม่

คู่เงิน GBP/USD ยังคงซื้อขายด้วยความผันผวนต่ำในวันศุกร์ โดยยังคงอยู่ในกรอบด้านข้างระหว่าง 1.2913 ถึง 1.2980 ตลอดสี่วันที่ผ่านมา ราคายังคงอยู่ในช่วงนี้อย่างสม่ำเสมอ แม้ว่าเงินปอนด์อังกฤษจะแข็งค่าอย่างมาก แต่ดูเหมือนจะไม่มีความโน้มเอียงในตลาดที่จะปรับตัวลงแม้เพียงเล็กน้อย ตลาดยังคงเพิกเฉยต่อข่าวเชิงบวกใดๆ สำหรับดอลลาร์ ดังที่เห็นเมื่อวันศุกร์ ในวันนั้น

Paolo Greco 22:26 2025-03-16 UTC+2

วิธีการเทรดคู่สกุลเงิน EUR/USD ในวันที่ 17 มีนาคม? เคล็ดลับง่าย ๆ และการวิเคราะห์การเทรดสำหรับมือใหม่

คู่สกุลเงิน EUR/USD แสดงถึงการพุ่งขึ้นอย่างสั้นๆ ในวันศุกร์ อย่างไรก็ตาม การพุ่งขึ้นนี้เกิดขึ้นในระยะเวลาสั้นและไม่ได้มีกำลังมากนัก การเพิ่มขึ้นของมูลค่าเงินยูโรเกิดขึ้นระหว่างช่วงการซื้อขายในยุโรป ทั้งที่ไม่มีรายงานหรือประกาศสำคัญใดๆ ออกมา ข้อมูลเพียงอย่างเดียวคือการประเมินอัตราเงินเฟ้อของเยอรมันฉบับที่สองในเดือนกุมภาพันธ์ ซึ่งตรงกับการประเมินครั้งแรก ดังนั้นจึงสามารถสรุปได้ว่าเงินยูโรมีมูลค่าเพิ่มขึ้นโดยไม่มีเหตุผลที่ชัดเจน ก่อนหน้านี้ได้กล่าวไปแล้วว่าการเคลื่อนไหวของตลาดในปัจจุบันส่วนใหญ่ได้รับอิทธิพลจากการตัดสินใจและแถลงการณ์ของ Donald Trump

Paolo Greco 22:26 2025-03-16 UTC+2

GBP/USD: แผนการเทรดสำหรับช่วงการซื้อขายในสหรัฐฯ วันที่ 14 มีนาคม (บทวิจารณ์การเทรดช่วงเช้า)

ในบทวิเคราะห์ตอนเช้าของฉัน ฉันมุ่งเน้นไปที่ระดับ 1.2949 และวางแผนที่จะตัดสินใจซื้อขายโดยยึดตามระดับนี้ มาดูกราฟ 5 นาทีเพื่อดูสิ่งที่เกิดขึ้นกัน การเพิ่มขึ้นตามมาด้วยการเบรกเอาต์ที่ผิดพลาดที่ 1.2949 ทำให้เกิดโอกาสในการขายที่ดี นำไปสู่การลดลงของคู่สกุลเงิน 20 จุด ภาพทางเทคนิคยังคงไม่เปลี่ยนแปลงสำหรับช่วงครึ่งหลังของวัน เงินปอนด์อังกฤษแสดงการปรับตัวลงเพียงเล็กน้อยหลังจากมีข่าวว่า

Miroslaw Bawulski 15:25 2025-03-14 UTC+2

EUR/USD: แผนการซื้อขายสำหรับช่วงการซื้อขายสหรัฐฯ ในวันที่ 14 มีนาคม (ทบทวนการซื้อขายช่วงเช้า)

ในคำพยากรณ์ช่วงเช้าของฉัน ฉันได้มุ่งเน้นไปที่ระดับ 1.0852 และวางแผนตัดสินใจซื้อขายบนพื้นฐานของระดับนี้ มาดูกราฟ 5 นาทีเพื่อตรวจสอบว่าเกิดอะไรขึ้น การปรับตัวขึ้นตามมาด้วยการทะลุระดับที่ซ้อนกันที่ 1.0852 ซึ่งให้จุดเข้าเปิดสถานะขายที่ดีเยี่ยม แต่คู่เงินนี้กลับไม่สามารถลงได้อย่างมีนัยสำคัญ แนวโน้มทางเทคนิคได้รับการปรับปรุงสำหรับช่วงครึ่งหลังของวัน ข้อมูลเงินเฟ้อจากเยอรมนีและฝรั่งเศสออกมาตรงตามที่คาดไว้ ส่งผลให้ค่าเงินยูโรแข็งค่าขึ้นเล็กน้อยในช่วงครึ่งแรกของวัน โดยในช่วงการซื้อขายของสหรัฐฯ

Miroslaw Bawulski 15:00 2025-03-14 UTC+2

วิธีการซื้อขายคู่ GBP/USD ในวันที่ 14 มีนาคมอย่างไร? ทิปง่ายๆ และการวิเคราะห์ธุรกิจสำหรับผู้เริ่มต้น

ในวันพฤหัสบดี, คู่สกุลเงิน GBP/USD ได้ประสบกับการลดลงเล็กน้อย แต่ยังคงอยู่ในช่วงที่แคบมากๆ ซึ่งคล้ายกับช่องทางตามแนวขวาง สกุลเงินปอนด์สหราชอาณาจักรได้มีการขยับขึ้นลงระหว่างระดับ 1.2913 และ 1.2980 มาหลายวันแล้ว แม้ว่าจะมีการส่งเสริมที่สำคัญ การแก้ไขยังไม่ได้เริ่มขึ้นหมายความว่าตลาดในปัจจุบันไม่ได้มุ่งความสนใจในการซื้อดอลลาร์หรือเก็บกำไรจากตำแหน่งที่ยาวส่วนใหญ่ปัจจัรติมิติทางสภาพคล่อง และ ปัจจัรติมิติพื้นฐาน

Paolo Greco 06:07 2025-03-14 UTC+2

วิธีการซื้อขายคู่เงิน EUR/USD ในวันที่ 14 มีนาคม? เคล็ดลับง่ายๆ และการวิเคราะห์การซื้อขายสำหรับผู้เริ่มต้น

ในวันพฤหัสบดี คู่เงิน EUR/USD ยังคงมีแนวโน้มลงอย่างปานกลางหลังจากเกิดการขึ้นราคาที่กินระยะเวลาหนึ่งสัปดาห์ครึ่ง ซึ่งได้รับแรงหนุนจากสถานการณ์ที่เกี่ยวข้องกับ Donald Trump ตลาดได้หยุดการขายออกของค่าเงินดอลลาร์ แต่ยังไม่แน่นอนว่าจะคงอยู่ได้นานเท่าใด เมื่อเร็วๆ นี้ นักเทรดให้ความสนใจเฉพาะเรื่องการเก็บภาษี โดยไม่สนใจข่าวสารอื่นๆ แม้ว่า Trump

Paolo Greco 06:07 2025-03-14 UTC+2
หากไม่สะดวกคุยในตอนนี้
ระบุคำถามไว้ได้ใน แชท.
Widget callback
 

Dear visitor,

Your IP address shows that you are currently located in the USA. If you are a resident of the United States, you are prohibited from using the services of InstaFintech Group including online trading, online transfers, deposit/withdrawal of funds, etc.

If you think you are seeing this message by mistake and your location is not the US, kindly proceed to the website. Otherwise, you must leave the website in order to comply with government restrictions.

Why does your IP address show your location as the USA?

  • - you are using a VPN provided by a hosting company based in the United States;
  • - your IP does not have proper WHOIS records;
  • - an error occurred in the WHOIS geolocation database.

Please confirm whether you are a US resident or not by clicking the relevant button below. If you choose the wrong option, being a US resident, you will not be able to open an account with InstaForex anyway.

We are sorry for any inconvenience caused by this message.