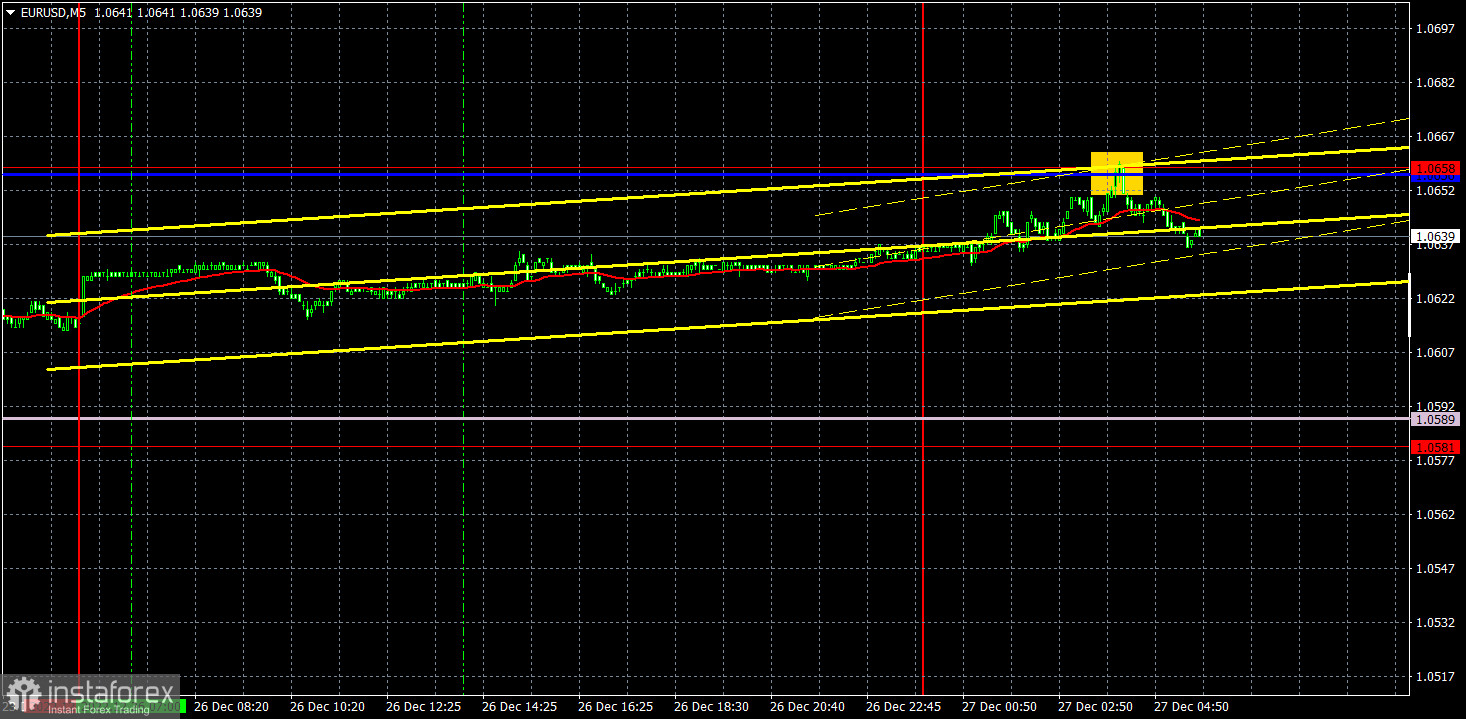
M5 chart of EUR/USD
EUR/USD is still trading within the 1.0581-1.0658 horizontal channel on Monday. As I mentioned earlier, such a clear horizontal channel is more of a good thing right now since traders have clear reference points that they can use. But in general, there is no such movement, which is naturally hard to consider as a favorable time to trade. Not only was there no trend on Monday, there was basically no movement. The volatility of the day was about 20 points, and there were no reports or events in the US or the EU. This is probably due to the Christmas holidays. Many platforms, exchanges and companies were simply closed on Monday.
No trading signals on Monday, which means that you shouldn't enter the market. Today, the situation might improve a bit (in terms of volatility), but we probably won't see any movement outside the 1.0581-1.0658 channel. Especially considering the overnight rebound from the upper limit, which could be regarded as a sell signal. Now the pair can go down to 1.0581.
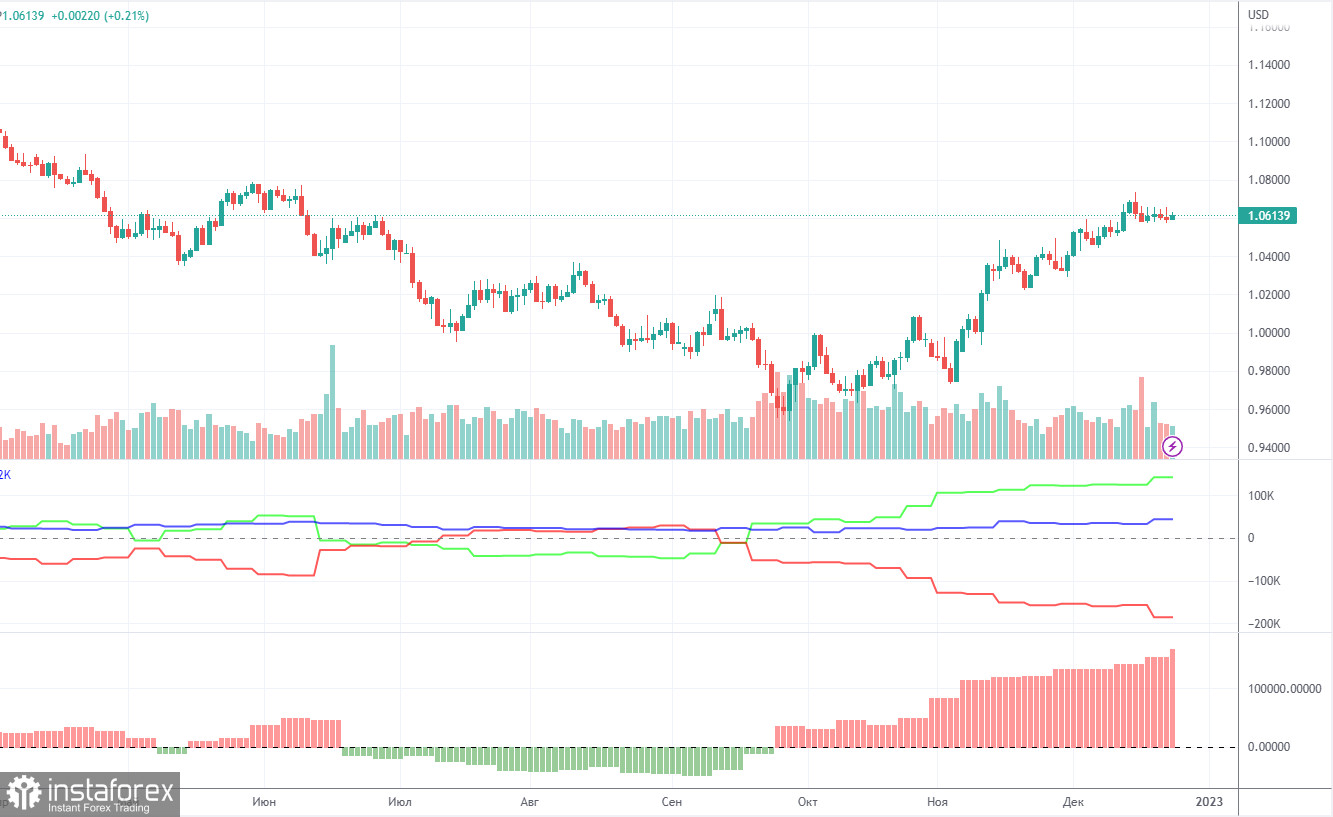
COT report
The COT reports for the euro in the last few months have been fully consistent with what is happening in the market. You can clearly see on the chart that the net position of big players (the second indicator) has been growing since early September. Around the same time, the euro started to grow. At this time, the net position of the non-commercial traders has been bullish and strengthens almost every week, but it is a rather high value that allows us to assume that the upward movement will end soon. Notably, the green and red lines of the first indicator have moved far apart from each other, which often means the end of the trend. During the given period, non-commercial traders opened 12,700 long positions, whereas the number of short positions fell by 4,800. Thus, the net positions rose by 7,900. The number of long positions is 143,000 higher than the number of short positions opened by non-commercial traders. So the question now is how long will the big players increase their longs? From our point of view, this process can not continue for another 2 or 3 months. Even the net position indicator shows that we need to "unload" a bit, that is, to adjust. The overall number of short orders exceeds the number of long orders by 43,000 (684,000 vs. 641,000).
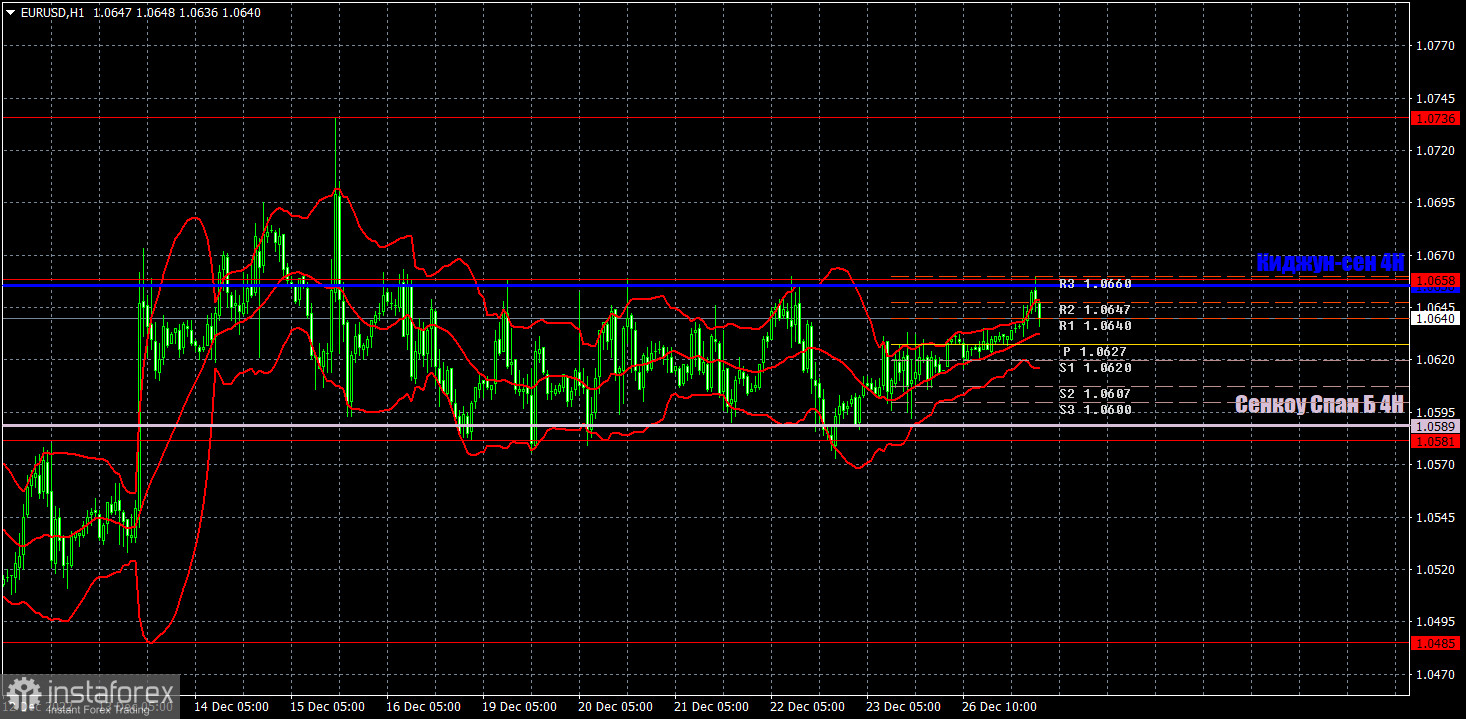
H1 chart of EUR/USD
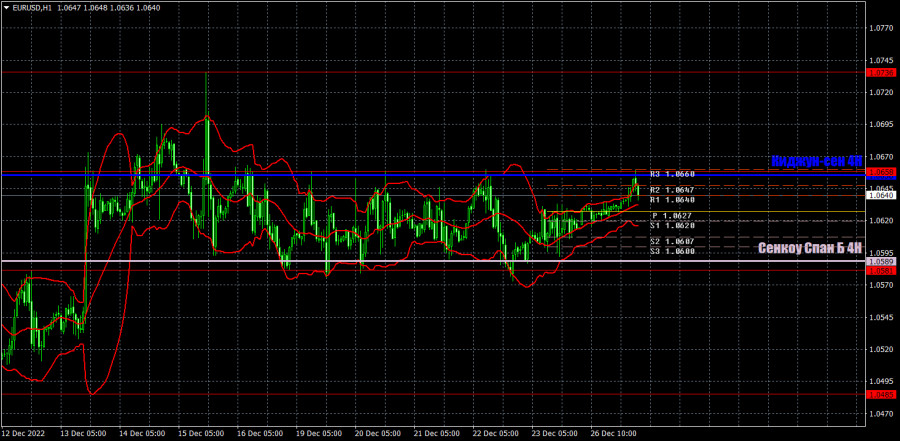
EUR/USD is still in a high position on the one-hour chart, and is still in a total flat. Lines of the Ichimoku indicator have already merged with each other and have lost meaning. As we can see, they are being worked out with precision. You should go for the 1.0581-1.0658 channel. If EUR manages to go beyond it, then we can count on some trend movement. Or you should continue to trade on a rebound from these levels. On Tuesday, the pair may trade at the following levels: 1.0340-1.0366, 1.0485, 1.0581, 1.0658, 1.0736, 1.0806, as well as Senkou Span B (1.0589) and Kijun Sen (1.0656). Lines of the Ichimoku indicator may move during the day, which should be taken into account when determining trading signals. There are also support and resistance levels, but signals are not formed near these levels. Bounces and breakouts of the extreme levels and lines could act as signals. Don't forget about stop-loss orders, if the price covers 15 pips in the right direction. This will prevent you from losses in case of a false signal. On December 27, no important report or event scheduled in the EU and the US. I don't expect the flat to end today. Volatility will probably remain low.
What we see on the trading charts:
Price levels of support and resistance are thick red lines, near which the movement may end. They do not provide trading signals.
The Kijun-sen and Senkou Span B lines are the lines of the Ichimoku indicator, moved to the one-hour chart from the 4-hour one. They are strong lines.
Extreme levels are thin red lines from which the price bounced earlier. They provide trading signals.
Yellow lines are trend lines, trend channels, and any other technical patterns.
Indicator 1 on the COT charts reflects the net position size of each category of traders.
Indicator 2 on the COT charts reflects the net position size for the non-commercial group.