On Friday, the EUR/USD currency pair finally reached parity. It can now be seen even on the 4-hour TF. The price completely disregards the sideways-pointing moving average line. As a result, there isn't much to analyze right now because there aren't any movements. However, several macroeconomic reports were released on Friday that could move the pair from the dead spot. First, we take note of the report on long-term goods orders, which came in much worse than expected. Reports on Americans' income and expenses are in the second. The market's mood was unaffected by either the first or second, though. Once more: this isn't your typical flat; rather, it's more like a New Year's. It is because there is currently no fundamental background, no macroeconomic data, and no trading motivation. Therefore, in our opinion, all that is left to do is wait until the holiday season is over. We do caution that the flat might still exist in early January 2023.
In theory, we now anticipate the euro/dollar pair to behave the same way as the dollar/pound pair. Specifically, downward adjustments after a sharp correction. The euro is not decreasing if the pound sterling is even slightly doing so. We think that, by an 80 percent margin, the option in which the pair simply resumes its upward trend after being flat for a few weeks is excluded. This is a market, though. On it, anything is possible. Recall that oil reached a value of $0 a few years ago, which was previously unthinkable.
There are still no drivers of growth for the euro.
Only the year's most significant events can be remembered in the final days of the previous year. We think that the anticipated slowdown in Fed rate growth has been the main driver of the pair's movement in recent months. Because of this, the euro was gaining value while the US dollar was sharply declining. However, given that the ECB has also started to slow down the pace of tightening monetary policy, we also think that the euro currency no longer benefits from this support factor. Furthermore, if everything is more or less understood by the Fed, it is not understood by the ECB. It's still unclear how much the European regulator plans to increase the key rate. But the answer to this question will have a significant impact on the future of the euro. Why shouldn't the euro fall now if the market was actively selling the dollar when it became clear that the Fed's rate of growth would slow down? Additionally, the European Union's recession is still anticipated to be "soft."
Gas prices have stabilized and significantly decreased, which will relieve economic pressure. On the one hand, this might even permit the ECB to keep raising rates as much as is necessary, but Christine Lagarde and Luis de Guindos almost brazenly admitted in their speeches that they are unsure of how high rates will go. The phrase "we don't know how much we can raise rates" also sounded like it. Generally speaking, we think that a flat should end before at least a downward correction occurs.
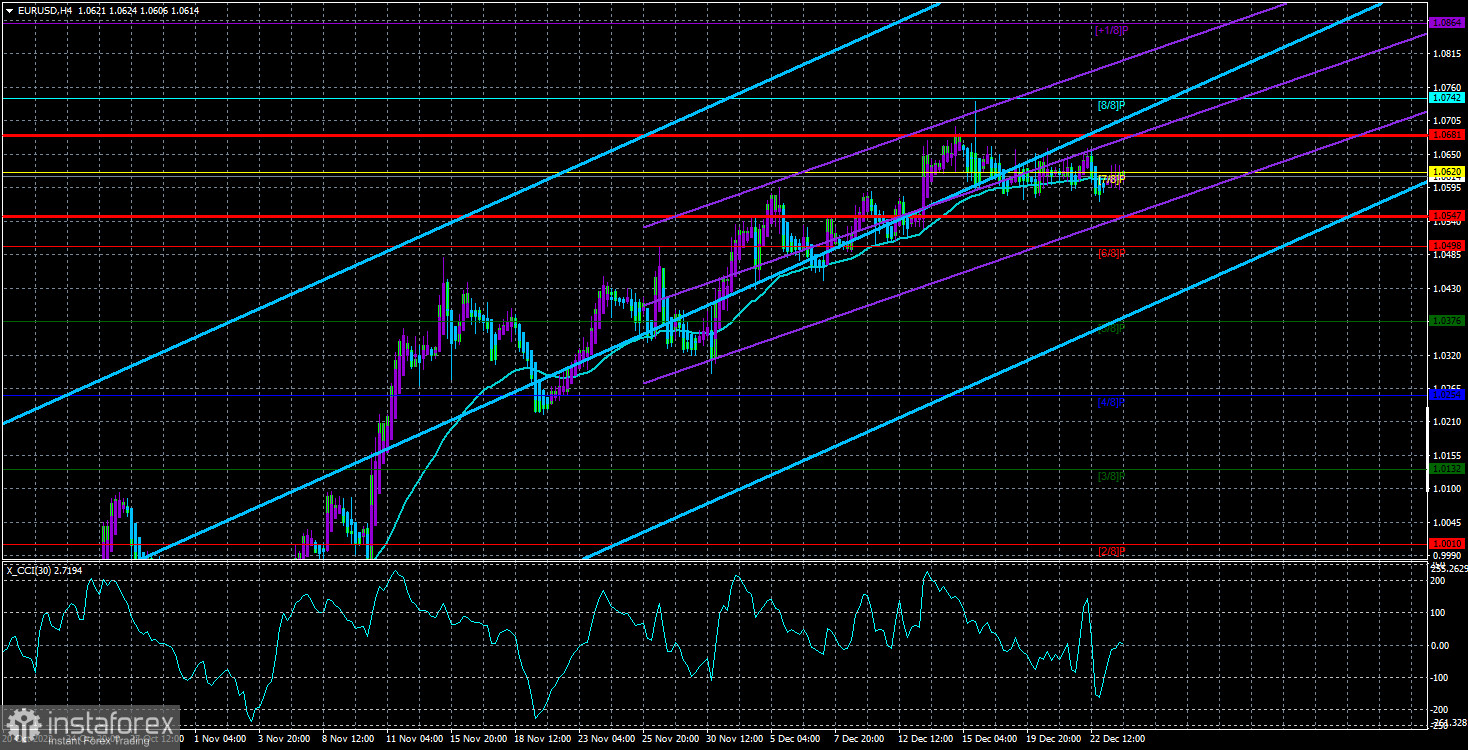
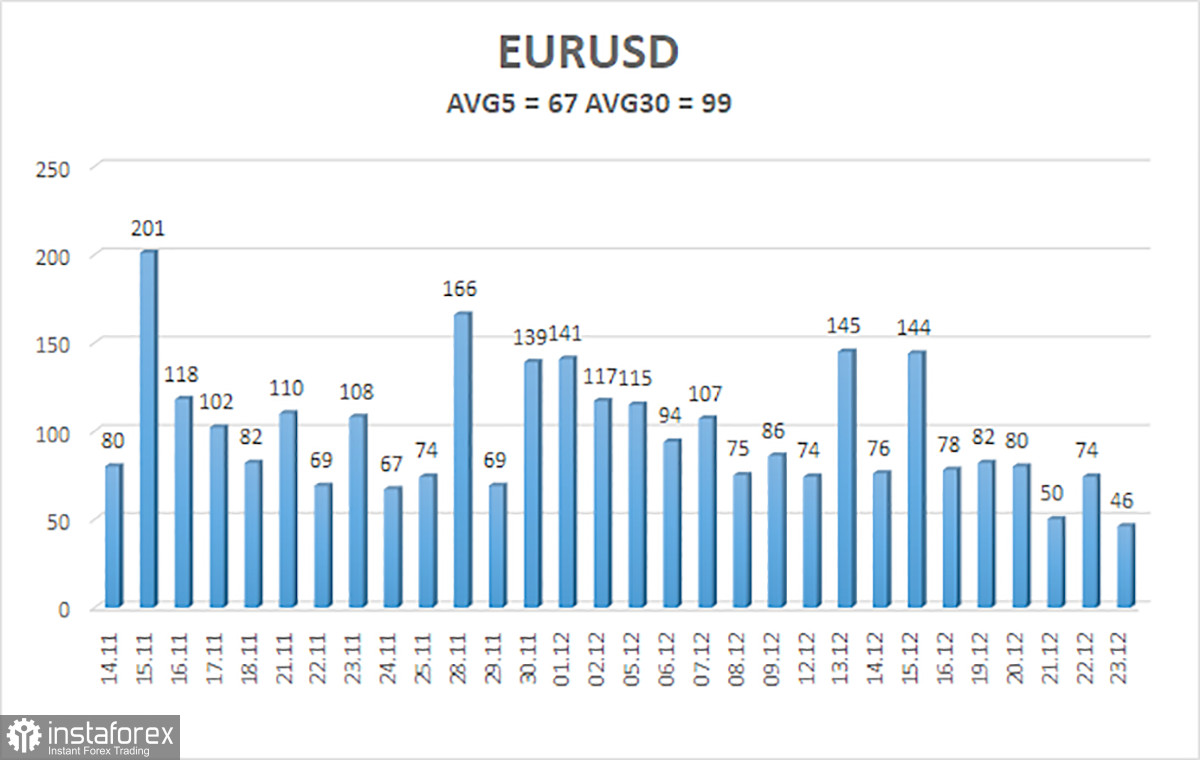
As of December 26, the euro/dollar currency pair's average volatility over the previous five trading days was 67 points, which is considered "average." So, on Monday, we anticipate the pair to fluctuate between 1.0547 and 1.0681 levels. The Heiken Ashi indicator's reversals are now completely irrelevant because the pair is flat.
Nearest levels of support
S1 – 1.0498
S2 – 1.0376
S3 – 1.0254
Nearest levels of resistance
R1 – 1.0620
R2 – 1.0742
R3 – 1.0864
Trading Suggestions:
Although the EUR/USD pair has been flattening out for several days, it is still maintaining an upward trend. Trading can only be done on the lower TF inside the side channel because the 4-hour TF hardly ever moves.
Explanations for the illustrations:
Channels for linear regression help identify the current trend. The trend is currently strong if they are both moving in the same direction.
Moving average line (settings 20.0, smoothed): This indicator identifies the current short-term trend and the trading direction.
Murray levels serve as the starting point for adjustments and movements.
Based on current volatility indicators, volatility levels (red lines) represent the likely price channel in which the pair will trade the following day.
A trend reversal in the opposite direction is imminent when the CCI indicator crosses into the overbought (above +250) or oversold (below -250) zones.