M5 chart of GBP/USD
GBP/USD failed to settle below the critical line on Monday, so the uptrend (if it can be considered as such now) is still present. At the moment, the price is still above the Ichimoku indicator, but it stopped rising, and the pair failed to surpass 1.2342. The pound rose 2000 pips in the recent months, which is unreasonably high in my perspective. I'm still waiting for a strong bearish correction. It might have started on Monday, but the UK GDP report turned out to be neutral, and the industrial production was completely in line with the forecasted values. In general, the pound showed exactly the same movements as the euro did. So, traders have to wait for all those events and reports, which are scheduled for this week. They will be available starting today.
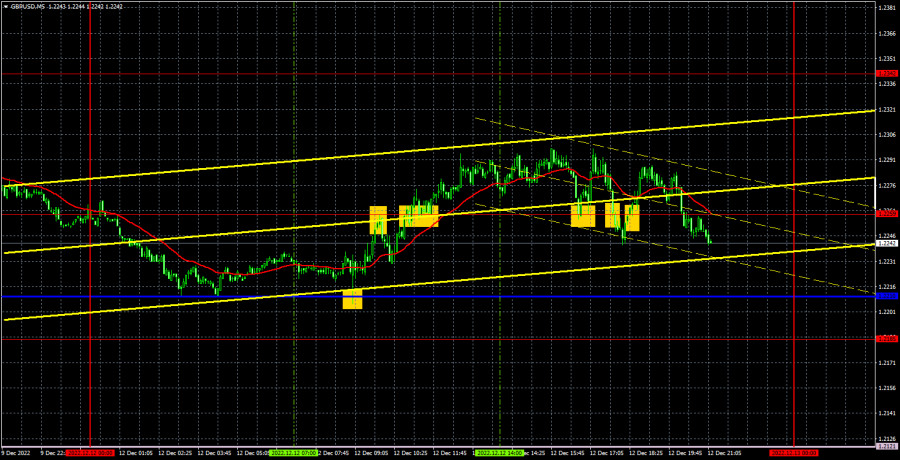
Speaking of trading signals, everything was quite messy. All the signals, except for the first one, were formed near 1.2259, which is a sign of a flat. Maybe, there was no flat on Monday, but the movement was still unpleasant. You could earn about 10 pips on the first buy signal near the critical line, because a sell signal followed near the first obstacle. This signal turned out to be false, as well as all subsequent ones. Therefore, traders could work only the first two. The first trade closed with a loss, the second - with the Stop Loss at breakeven. As a result, the day ended either with minimal loss or nothing.
COT report

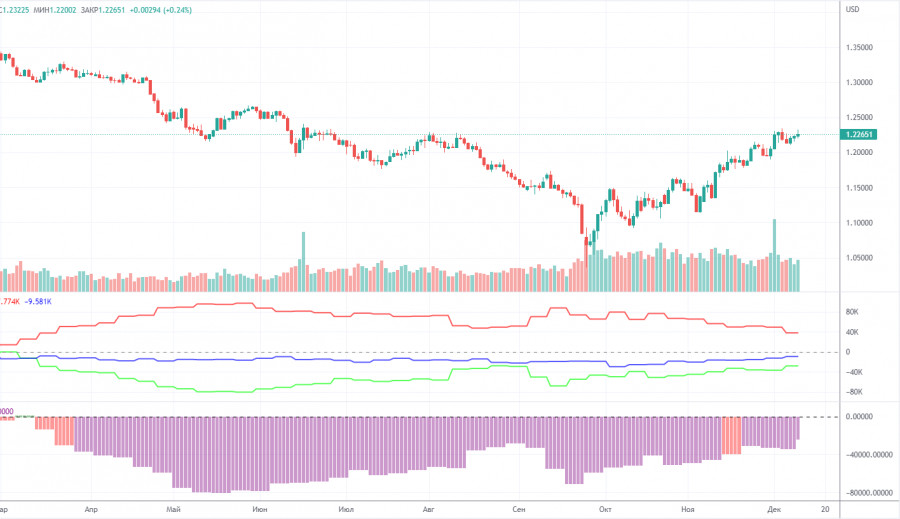
The latest COT report on the British pound showed that the bearish mood is weakening. During the reporting week, non-commercial traders opened 1,700 long positions and closed 7,800 short ones. The net position increased by almost 10,000. The net position dropped by 1,000. The figure has been on the rise for several months. Nevertheless, sentiment remains bearish, and the pound is on the rise against the greenback for no reason. We assume that the pair may well resume the downtrend soon. Notably, both GBP/USD and EUR/USD now show practically identical movement. At the same time, the net position on EUR/USD is positive and negative on GBP/USD. Non-commercial traders now hold 54,000 sell positions and 30,000 long ones. The gap between them is quite wide. As for the total number of open longs and shorts, the bulls have an advantage here by 10,000. Technical factors indicate that the pound may move in an uptrend in the long term. At the same time, fundamental and geopolitical factors signal that the currency is unlikely to strengthen significantly.
H1 chart of GBP/USD

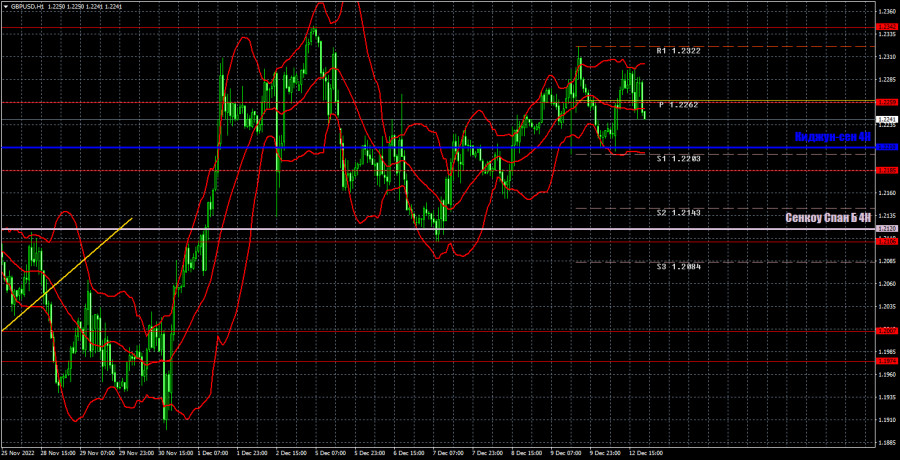
GBP/USD continues to trade very high on the one-hour chart, but still tries to maintain a corrective mood since the highs are no longer updated. This week everything will depend on the macro data and meetings of the central banks, so the movements may be very strong and can turn in any direction. We should be ready for any developments. On Tuesday, the pair may trade at the following levels: 1.1874, 1.1974-1.2007, 1.2106, 1.2185, 1.2259, 1.2342, 1.2429-1.2458. The Senkou Span B (1.2121) and Kijun Sen (1.2210) lines may also generate signals. Pullbacks and breakouts through these lines may produce signals as well. A Stop Loss order should be set at the breakeven point after the price passes 20 pips in the right direction. Ichimoku indicator lines may move during the day, which should be taken into account when determining trading signals. In addition, the chart does illustrate support and resistance levels, which could be used to lock in profits. There are no interesting events planned for Great Britain, but the market should be satisfied with the US inflation report. Of course, if the actual value of this report completely coincides with the forecast, then there might not be any reaction, but you should still be prepared in case the pair moves sharply.
What we see on the trading charts:
Price levels of support and resistance are thick red lines, near which the movement may end. They do not provide trading signals.
The Kijun-sen and Senkou Span B lines are the lines of the Ichimoku indicator, moved to the one-hour chart from the 4-hour one. They are strong lines.
Extreme levels are thin red lines from which the price bounced earlier. They provide trading signals.
Yellow lines are trend lines, trend channels, and any other technical patterns.
Indicator 1 on the COT charts reflects the net position size of each category of traders.
Indicator 2 on the COT charts reflects the net position size for the non-commercial group.


