empty
24.11.2021 04:29 AM
Forecast and trading signals for EUR/USD on November 24. Detailed analysis of the pair's movement and trade deals. FOMC minutes and important reports in the United States

EUR/USD 5M

This image is no longer relevant

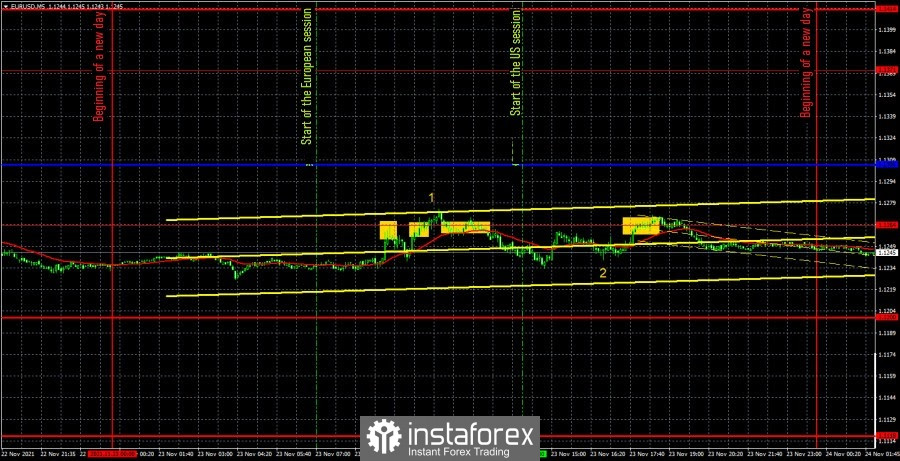
The EUR/USD pair retained its downward trend again on Tuesday, although it would be very difficult to break it within one day if it formed over the past several weeks, at least. The pair moved mainly sideways throughout the day, as evidenced by both linear regression channels. Unfortunately, several false trading signals were generated as well. More precisely, all trading signals that were generated on Tuesday turned out to be false. But what else could be expected from the pair if its volatility was again around 50 points? It seems to be not very small, but provided there is no trend intraday movement, it is not enough. During the day, the European Union and the United States published business activity indices for the services and manufacturing sectors (the time of their publication is the numbers "1" and "2" in the chart). As you can see, there was no market reaction to these reports. However, the reports themselves are "to blame" for this, since they turned out to be as neutral as possible. Thus, all we have to do is to understand the trading signals and understand how we should have worked yesterday. The first signal - to sell - was formed upon a rebound from the level of 1.1264. After that, the pair managed to go down as much as 15 points, after which it returned to the level of 1.1264 and settled above it. Thus, a short position was closed by Stop Loss at breakeven, and traders had to immediately open long positions at a buy signal. However, the pair could not go up even 10 points, and after a few hours it settled back below the level of 1.1264. Thus, the second trade brought a loss to traders worth 12 points. All subsequent signals near the level of 1.1264 should not have been worked out for sure, since two whole signals had turned out to be false by that time.

EUR/USD 1H

This image is no longer relevant

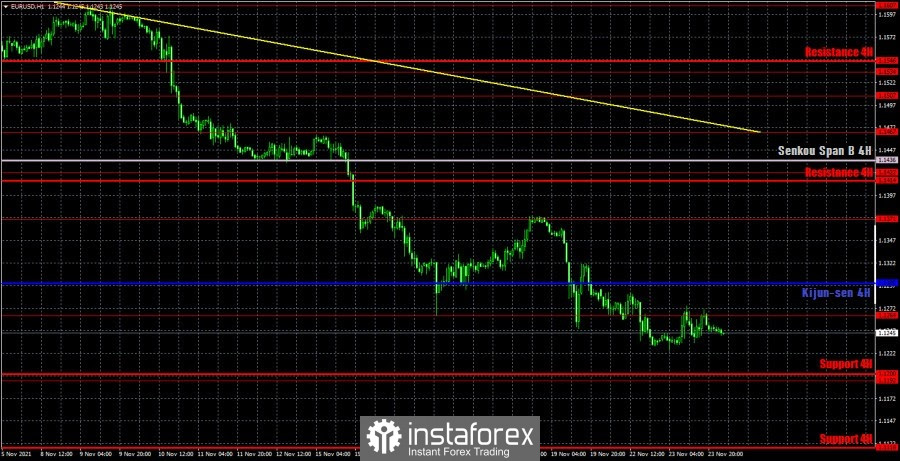
The downward movement continues on the hourly timeframe, and the downward trend is beyond doubt, since the trend line remains relevant. The price continues to be far enough from this line, and the European currency still cannot adjust to it in any way. Thus, although the volatility is not too high this week, and the fundamental and macroeconomic background is practically absent, the euro cannot even begin a correction, so the chances of its fall remain high. We highlight the following levels for trading on Wednesday - 1.1192, 1.1264, 1.1371, 1.1422, as well as the Senkou Span B (1.1436) and Kijun-sen (1.1300) lines. The Ichimoku indicator lines can change their position during the day, which should be taken into account when looking for trading signals. Signals can be rebounds or breakthroughs of these levels and lines. Do not forget about placing a Stop Loss order at breakeven if the price moves 15 points in the right direction. This will protect you against possible losses if the signal turns out to be false. There will not be a single important event or publication in the European Union on November 24. But in the US, several important reports will be released at once, and in the evening the FOMC minutes will be published. Particular attention should be paid to reports on durable goods orders, GDP for the third quarter, as well as personal income and spending of Americans. Under certain circumstances, all of these reports can be easily ignored. But at the same time, the reaction to them can be quite strong, so you should not ignore them.

We recommend you to familiarize yourself:

Overview of the EUR/USD pair. November 24. European economy may need new stimulus... Coronavirus continues to rage

Overview of the GBP/USD pair. November 24. The British pound tried to perk up, but quickly wilted. Coronavirus is attacking Britain too

Forecast and trading signals for GBP/USD for November 24. Detailed analysis of the movement of the pair and trade deals.

Analysis of the COT report

This image is no longer relevant

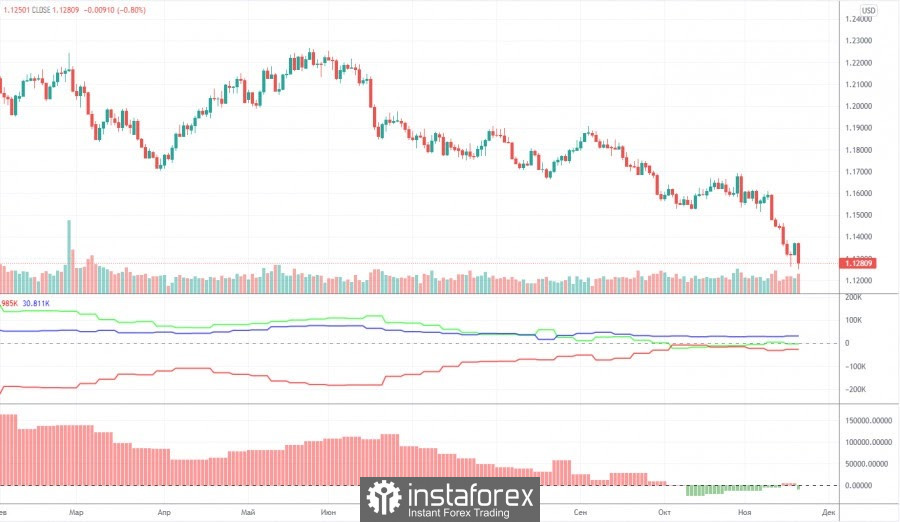
The mood of non-commercial traders changed quite significantly during the last reporting week (November 9-15). A group of non-commercial traders opened 7,000 buy contracts (longs) and 20,500 sell contracts (shorts) during the week. Thus, the net position for professional traders decreased by 13,500, and the mood became more "bearish". It should be noted that the European currency has dropped quite seriously over the past few weeks. But the net position for the "non-commercial" group, starting from October, practically does not change. This is signaled by the green line of the first indicator in the chart above. Almost all this time, it has been near the zero level, indicating the absence of serious changes in the mood of major players. Thus, if the general trend remains the same - over the past ten months, large players have seriously reduced the number of longs and increased the number of shorts, then in the past few weeks nothing of the kind has been observed, and the European currency was still falling. This suggests that what is happening on the market now does not quite correspond to the actions of large players. The second indicator (the net position for professional traders in the form of a histogram) shows that in the last six weeks the mood of traders has become less bearish, that is, in theory, at this time the euro should have been growing, not falling. Thus, if we draw a conclusion only on the basis of the Commitment of Traders (COT) reports, then a further fall in the euro currency is completely unclear.

Explanations for the chart:

Support and Resistance Levels are the levels that serve as targets when buying or selling the pair. You can place Take Profit near these levels.

Kijun-sen and Senkou Span B lines are lines of the Ichimoku indicator transferred to the hourly timeframe from the 4-hour one.

Support and resistance areas are areas from which the price has repeatedly rebounded off.

Yellow lines are trend lines, trend channels and any other technical patterns.

Indicator 1 on the COT charts is the size of the net position of each category of traders.

Indicator 2 on the COT charts is the size of the net position for the non-commercial group.

Paolo Greco,
ผู้เชี่ยวชาญด้านการวิเคราะห์ของ InstaForex
© 2007-2025
เลือกช่วงเวลา
5
นาที
15
นาที
30
นาที
1
ชั่วโมง
4
ชั่วโมง
1
วัน
1
สัปดาห์
รับผลกำไรจากการเปลี่ยนแปลงอัตราสกุลเงินดิจิทัลกับ InstaForex.
ดาวน์โหลด MetaTrader 4 และเปิดการซื้อขายครั้งแรกของคุณ.
  • Grand Choice
    Contest by
    InstaForex
    InstaForex always strives to help you
    fulfill your biggest dreams.
    เข้าร่วมการแข่งขัน


บทความแนะนำ

GBP/USD: แผนการเทรดสำหรับช่วงการซื้อขายในสหรัฐฯ วันที่ 14 มีนาคม (บทวิจารณ์การเทรดช่วงเช้า)

ในบทวิเคราะห์ตอนเช้าของฉัน ฉันมุ่งเน้นไปที่ระดับ 1.2949 และวางแผนที่จะตัดสินใจซื้อขายโดยยึดตามระดับนี้ มาดูกราฟ 5 นาทีเพื่อดูสิ่งที่เกิดขึ้นกัน การเพิ่มขึ้นตามมาด้วยการเบรกเอาต์ที่ผิดพลาดที่ 1.2949 ทำให้เกิดโอกาสในการขายที่ดี นำไปสู่การลดลงของคู่สกุลเงิน 20 จุด ภาพทางเทคนิคยังคงไม่เปลี่ยนแปลงสำหรับช่วงครึ่งหลังของวัน เงินปอนด์อังกฤษแสดงการปรับตัวลงเพียงเล็กน้อยหลังจากมีข่าวว่า

Miroslaw Bawulski 15:25 2025-03-14 UTC+2

EUR/USD: แผนการซื้อขายสำหรับช่วงการซื้อขายสหรัฐฯ ในวันที่ 14 มีนาคม (ทบทวนการซื้อขายช่วงเช้า)

ในคำพยากรณ์ช่วงเช้าของฉัน ฉันได้มุ่งเน้นไปที่ระดับ 1.0852 และวางแผนตัดสินใจซื้อขายบนพื้นฐานของระดับนี้ มาดูกราฟ 5 นาทีเพื่อตรวจสอบว่าเกิดอะไรขึ้น การปรับตัวขึ้นตามมาด้วยการทะลุระดับที่ซ้อนกันที่ 1.0852 ซึ่งให้จุดเข้าเปิดสถานะขายที่ดีเยี่ยม แต่คู่เงินนี้กลับไม่สามารถลงได้อย่างมีนัยสำคัญ แนวโน้มทางเทคนิคได้รับการปรับปรุงสำหรับช่วงครึ่งหลังของวัน ข้อมูลเงินเฟ้อจากเยอรมนีและฝรั่งเศสออกมาตรงตามที่คาดไว้ ส่งผลให้ค่าเงินยูโรแข็งค่าขึ้นเล็กน้อยในช่วงครึ่งแรกของวัน โดยในช่วงการซื้อขายของสหรัฐฯ

Miroslaw Bawulski 15:00 2025-03-14 UTC+2

วิธีการซื้อขายคู่ GBP/USD ในวันที่ 14 มีนาคมอย่างไร? ทิปง่ายๆ และการวิเคราะห์ธุรกิจสำหรับผู้เริ่มต้น

ในวันพฤหัสบดี, คู่สกุลเงิน GBP/USD ได้ประสบกับการลดลงเล็กน้อย แต่ยังคงอยู่ในช่วงที่แคบมากๆ ซึ่งคล้ายกับช่องทางตามแนวขวาง สกุลเงินปอนด์สหราชอาณาจักรได้มีการขยับขึ้นลงระหว่างระดับ 1.2913 และ 1.2980 มาหลายวันแล้ว แม้ว่าจะมีการส่งเสริมที่สำคัญ การแก้ไขยังไม่ได้เริ่มขึ้นหมายความว่าตลาดในปัจจุบันไม่ได้มุ่งความสนใจในการซื้อดอลลาร์หรือเก็บกำไรจากตำแหน่งที่ยาวส่วนใหญ่ปัจจัรติมิติทางสภาพคล่อง และ ปัจจัรติมิติพื้นฐาน

Paolo Greco 06:07 2025-03-14 UTC+2

วิธีการซื้อขายคู่เงิน EUR/USD ในวันที่ 14 มีนาคม? เคล็ดลับง่ายๆ และการวิเคราะห์การซื้อขายสำหรับผู้เริ่มต้น

ในวันพฤหัสบดี คู่เงิน EUR/USD ยังคงมีแนวโน้มลงอย่างปานกลางหลังจากเกิดการขึ้นราคาที่กินระยะเวลาหนึ่งสัปดาห์ครึ่ง ซึ่งได้รับแรงหนุนจากสถานการณ์ที่เกี่ยวข้องกับ Donald Trump ตลาดได้หยุดการขายออกของค่าเงินดอลลาร์ แต่ยังไม่แน่นอนว่าจะคงอยู่ได้นานเท่าใด เมื่อเร็วๆ นี้ นักเทรดให้ความสนใจเฉพาะเรื่องการเก็บภาษี โดยไม่สนใจข่าวสารอื่นๆ แม้ว่า Trump

Paolo Greco 06:07 2025-03-14 UTC+2

คำแนะนำและการวิเคราะห์การซื้อขายสำหรับ GBP/USD ในวันที่ 14 มีนาคม: เงินปอนด์อังกฤษไม่มีความพยายามมากนัก

คู่สกุลเงิน GBP/USD มีการเคลื่อนไหวถอยลงเล็กน้อยในวันพฤหัสบดี แต่ยังไม่สามารถยืนต่ำกว่าระดับสำคัญได้ เส้น Kijun-sen อยู่ใกล้กับราคาปัจจุบันมาก ในวันพฤหัสบดีไม่มีการเผยแพร่รายงานทางเศรษฐกิจสำคัญจากสหราชอาณาจักร ถึงแม้ว่าจะมีข้อมูลจากสหรัฐฯ บ้าง แต่ปฏิกิริยาของตลาดมีน้อยอย่างมากจนแทบมองไม่เห็นในกราฟ 5 นาที ในขณะเดียวกัน Donald

Paolo Greco 02:38 2025-03-14 UTC+2

คำแนะนำและการวิเคราะห์การซื้อขายสำหรับ EUR/USD ณ วันที่ 14 มีนาคม: ยูโรแสร้งทำเป็นแก้ไข

คู่สกุลเงิน EUR/USD แสดงให้เห็นถึงความผันผวนที่ต่ำมากในวันพฤหัสบดี โดยมีการแก้ไขเพียงเล็กน้อยเท่านั้น ในสัปดาห์ที่ผ่านมานั้น ยูโรได้เพิ่มขึ้นถึง 600 จุด และการเคลื่อนไหวขาขึ้นทั้งหมดนี้ไม่เข้าไปในกราฟด้วยซ้ำ ดังนั้นการดึงกลับในปัจจุบันที่ 70-80 จุดจึงไม่สำคัญเท่าไรนัก เป็นเรื่องที่ท้าทายที่จะระบุว่า ตลาดได้หยุดตอบสนองต่อมาตรการของ Donald

Paolo Greco 02:38 2025-03-14 UTC+2

GBP/USD: แผนการเทรดสำหรับช่วงการซื้อขายในสหรัฐอเมริกาในวันที่ 13 มีนาคม (การทบทวนการซื้อขายในช่วงเช้า)

ในการคาดการณ์ของผมในช่วงเช้า ผมให้ความสำคัญกับระดับ 1.2949 และวางแผนที่จะตัดสินใจทางการค้าตามระดับนี้ มาดูกราฟในช่วง 5 นาทีและวิเคราะห์สิ่งที่เกิดขึ้น การลดลงและการเบรกเอาท์ที่ผิดพลาดบริเวณ 1.2949 ทำให้มีจุดเข้าในการซื้อเงินปอนด์ แต่คู่เงินนี้ไม่สามารถเห็นการเติบโตที่สำคัญได้ ในภาพทางเทคนิคนี้ยังไม่ได้รับการเสนอสิ่งใหม่สำหรับช่วงครึ่งหลังของวัน แม้ผู้ซื้อเงินปอนด์ยังคงมีอยู่ แต่ยังไม่สามารถสร้างแรงส่งที่แข็งแกร่งได้ ในช่วงครึ่งหลังของวันข้อมูลราคาผู้ผลิตของสหรัฐฯ

Miroslaw Bawulski 18:26 2025-03-13 UTC+2

EUR/USD: แผนการเทรดสำหรับเซสชันสหรัฐฯ ในวันที่ 13 มีนาคม (รีวิวการเทรดในช่วงเช้า)

ในการพยากรณ์เช้าของฉัน, ฉันได้มุ่งเน้นที่ระดับ 1.0877 และวางแผนที่จะตัดสินใจการซื้อขายด้วยตัวมัน เรามาดูที่แผนภูมิ 5 นาทีและวิเคราะห์ว่าเกิดอะไรขึ้น การขาดแคลนและการล้มเหลวในการช่วงเวลานี้ได้ให้จุดเข้าชั้นยอดสำหรับตำแหน่งยาว แต่คู่หุ้นนี้ไม่สามารถมองเห็นการเติบโตที่สำคัญเนื่องจากการซื้อขายยังคงครอบคลุมในระดับนี้ ภาพทางเทคนิคได้รับการแก้ไขสำหรับช่วงหลังของวัน ในเวลาที่ไม่มีข้อมูลสถิติที่สำคัญ เหรียญยูโรของผู้ซื้อพยายามก่อให้เกิดความเคลื่อนไหวรอบ 1.0877 แต่การสร้างวาวสูงขึ้นและการปรับปรุงยอดสูงรายเดือนที่ผ่านมาไม่สามารถเกิดขึ้นได้ นี่คืออีกสัญญานคำเตือนสำหรับแทรกแซง

Miroslaw Bawulski 18:22 2025-03-13 UTC+2

วิธีการเทรดคู่เงิน GBP/USD ในวันที่ 13 มีนาคม? เคล็ดลับง่ายๆ และการวิเคราะห์การเทรดสำหรับผู้เริ่มต้น

ในวันพุธ คู่เงิน GBP/USD ยังคงเคลื่อนที่ขึ้น สาระสำคัญของรายงานเงินเฟ้อสหรัฐฯ ควรทำให้ดอลลาร์อ่อนลงอย่างน้อยเล็กน้อย โดยเฉพาะอย่างยิ่งเนื่องจากดอลลาร์ได้อ่อนตัวลงในช่วงสองเดือนที่ผ่านมาเนื่องจากหลายปัจจัย ในระดับท้องถิ่น เราเห็นการตอบสนองของตลาดที่คาดการณ์จากอัตราเงินเฟ้อที่ลดลงของสหรัฐฯ เนื่องจากสิ่งนี้สามารถกระตุ้นให้ Federal Reserve ใช้นโยบายเงินที่ผ่อนคลายมากขึ้น อย่างไรก็ตาม ยูโรไม่ได้เติบโตแต่อย่างใด

Paolo Greco 06:12 2025-03-13 UTC+2

วิธีการเทรดคู่สกุลเงิน EUR/USD ในวันที่ 13 มีนาคม? เคล็ดลับง่ายๆ และการวิเคราะห์การเทรดสำหรับมือใหม่

ในวันพุธ คู่สกุลเงิน EUR/USD ไม่สามารถสร้างฐานใหม่สำหรับการเคลื่อนไหวขาขึ้นได้ ซึ่งไม่น่าแปลกใจ เนื่องจากตลาดมีการตอบสนองต่อข่าวที่เกี่ยวข้องกับ Donald Trump เป็นหลัก โดยเฉพาะการประกาศภาษีใหม่ อย่างไรก็ตาม ตลาดมักละเลยข่าวเกี่ยวกับการเลื่อนหรือยกเลิกภาษีเหล่านี้ ในเชิงปฏิบัติ การเปลี่ยนแปลงนี้แสดงให้เห็นดังต่อไปนี้: เมื่อ

Paolo Greco 06:12 2025-03-13 UTC+2
หากไม่สะดวกคุยในตอนนี้
ระบุคำถามไว้ได้ใน แชท.
Widget callback
 

Dear visitor,

Your IP address shows that you are currently located in the USA. If you are a resident of the United States, you are prohibited from using the services of InstaFintech Group including online trading, online transfers, deposit/withdrawal of funds, etc.

If you think you are seeing this message by mistake and your location is not the US, kindly proceed to the website. Otherwise, you must leave the website in order to comply with government restrictions.

Why does your IP address show your location as the USA?

  • - you are using a VPN provided by a hosting company based in the United States;
  • - your IP does not have proper WHOIS records;
  • - an error occurred in the WHOIS geolocation database.

Please confirm whether you are a US resident or not by clicking the relevant button below. If you choose the wrong option, being a US resident, you will not be able to open an account with InstaForex anyway.

We are sorry for any inconvenience caused by this message.