empty
16.09.2021 04:32 AM
Forecast and trading signals for GBP/USD for September 16. Detailed analysis of the movement of the pair and trade deals. Pound continues to trade in different directions

GBP/USD 5M

This image is no longer relevant

The pound/dollar pair was trading very badly again on September 15. The volatility of the pair was just over 60 points yesterday, which is very little for it. Thus, trading actively and profitably failed again. There were few macroeconomic reports yesterday, but they were quite important. A report on inflation was published in the UK, which unexpectedly for many showed an acceleration in price growth to 3.2% in annual terms. After the publication of this report, the quotes of the British currency increased by 20 points (figure "1" in the chart). A report on industrial production was published in the US in the afternoon, which showed no deviations from the forecast value. Therefore, the movement that began after the publication (number "2" in the illustration) can hardly be associated with the report itself. This is most likely just a coincidence. In general, the pound/dollar pair managed to settle above both key lines of the Ichimoku indicator, but at the same time it could not continue to move up. During the day, there were only two signals that deserved attention. The first is overcoming the Senkou Span B line at the very beginning of the European session. The second - literally in half an hour, overcoming the Kijun-sen line. It was necessary to open long positions on these signals, but the upward movement, as already mentioned, did not continue. However, the signals themselves were not canceled, as the price failed to settle below the critical line. The pair returned to it three times and bounced off it thrice. Thus, traders were in long positions until the evening, which had to be manually closed in the end. As in the case of the euro/dollar pair, the profit turned out to be small, only 15-20 points.

Overview of the EUR/USD pair. September 16. The market is baffled by the decline in US inflation.

Overview of the GBP/USD pair. September 16. London threatens Brussels to withdraw from the Northern Ireland Protocol.
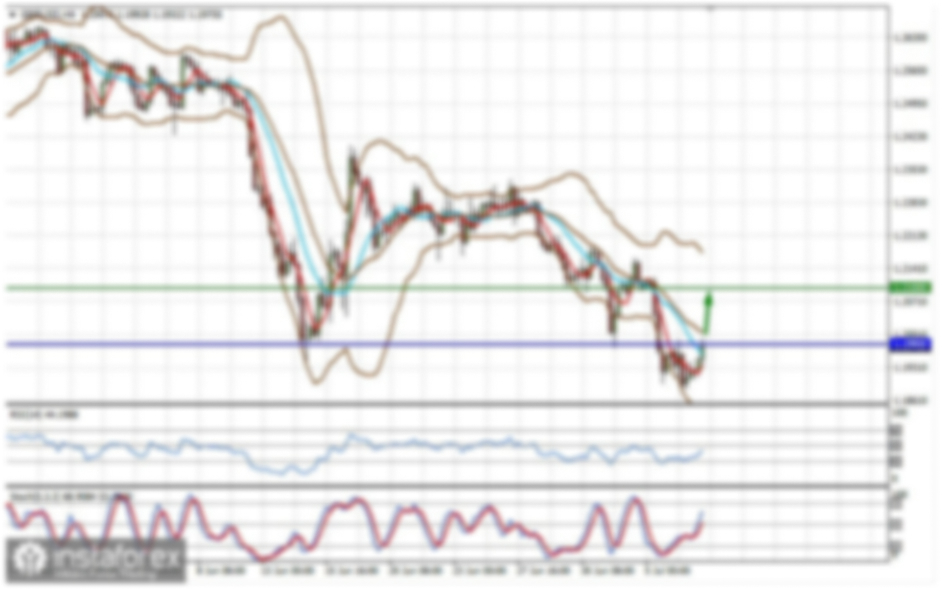
GBP/USD 1H

This image is no longer relevant

The GBP/USD pair continues to trade mainly between the levels of 1.3732 and 1.3886 on the hourly timeframe. This is, of course, not a horizontal channel, but still the pair is stuck without a definite trend in a limited range. For the second time in recent years, the price has overcome an upward formation (channel or trend line), but at the same time it cannot start moving down. Yesterday, quotes bounced off the level of 1.3794 and tried to start a new round of movement to the upside, but at the same time, low volatility did not allow the price to go far from the opening levels of the day. We continue to draw the attention of traders to the most important levels: 1.3732, 1.3785 - 1.3794, 1.3886, 1.3948. Senkou Span B (1.3784) and Kijun-sen (1.3833) lines can also be signal sources. It is recommended to set the Stop Loss level at breakeven when the price passes 20 points in the right direction. The Ichimoku indicator lines can move during the day, which should be taken into account when looking for trading signals. No major events and publications are scheduled in the UK on Thursday, September 16, and in America it will be possible to only pay attention to the retail sales report, which also may not provoke any reaction. Thus, with a high degree of probability the nature of the pound/dollar pair's movement will not change today.

We also recommend that you familiarize yourself with the forecast and trading signals for the EUR/USD pair.

COT report

This image is no longer relevant

The GBP/USD pair gained 80 points during the last reporting week (August 31 - September 6). The most important group of non-commercial traders continues to decrease their net position, and their mood is becoming increasingly bearish. These changes are clearly visible on the indicators in the chart above. The first indicator clearly shows that the green line (the net position of the "non-commercial" group) has already gone below the zero level and continues to decline. Simply put, the mood of the major players has already changed to bearish and is now only getting stronger. However, we still cannot conclude that the upward trend is over due to the too weak correction against this trend (recall: only 23.6%). It is the weakness of the correction over the past six months that does not allow us to conclude that a new downward trend has begun to form, and not just a correction. Thus, the major players continue to sell off the pound, while the currency itself, after three attempts, could not even go below the target area of 1.3600-1.3666. Therefore, we believe that in the first place in terms of importance is the factor of infusion of hundreds of billions of dollars into the US economy by the Federal Reserve, which ensures the depreciation of the dollar in the long run and does not allow it to strengthen too much in the short term. During the reporting week, non-commercial traders closed 5.5 thousand buy contracts (longs) and opened 2.5 thousand sell contracts (shorts). But despite the fact that the major players are bearish, this does not help the pound/dollar pair to continue moving below 1.3600.

Explanations for the chart:

Support and Resistance Levels are the levels that serve as targets when buying or selling the pair. You can place Take Profit near these levels.

Kijun-sen and Senkou Span B lines are lines of the Ichimoku indicator transferred to the hourly timeframe from the 4-hour one.

Support and resistance areas are areas from which the price has repeatedly rebounded off.

Yellow lines are trend lines, trend channels and any other technical patterns.

Indicator 1 on the COT charts is the size of the net position of each category of traders.

Indicator 2 on the COT charts is the size of the net position for the non-commercial group.

Paolo Greco,
ผู้เชี่ยวชาญด้านการวิเคราะห์ของ InstaForex
© 2007-2025
เลือกช่วงเวลา
5
นาที
15
นาที
30
นาที
1
ชั่วโมง
4
ชั่วโมง
1
วัน
1
สัปดาห์
รับผลกำไรจากการเปลี่ยนแปลงอัตราสกุลเงินดิจิทัลกับ InstaForex.
ดาวน์โหลด MetaTrader 4 และเปิดการซื้อขายครั้งแรกของคุณ.
  • Grand Choice
    Contest by
    InstaForex
    InstaForex always strives to help you
    fulfill your biggest dreams.
    เข้าร่วมการแข่งขัน


บทความแนะนำ

GBP/USD: แผนการซื้อขายสำหรับเซสชันสหรัฐฯ ในวันที่ 28 กุมภาพันธ์ (การวิเคราะห์การซื้อขายในช่วงเช้า)

ในบทวิเคราะห์เช้าของฉัน ฉันได้เน้นถึงระดับ 1.2607 ว่าเป็นจุดสำคัญในการตัดสินใจเข้าตลาด เมื่อดูที่กราฟ 5 นาที ราคาขยับขึ้นแต่ยังไม่ถึงขั้นทดสอบและสร้างการทะลุหลอกในบริเวณ 1.2607 ดังนั้นฉันจึงไม่ได้ทำการซื้อขายใดๆ สถานการณ์ทางเทคนิคได้รับการปรับปรุงใหม่สำหรับช่วงครึ่งหลังของวัน การเปิดสถานะซื้อยาวใน GBP/USD: การที่ไม่มีข้อมูลเศรษฐกิจจากสหราชอาณาจักรไม่ได้ช่วยให้ค่าเงินปอนด์ฟื้นตัว ดังนั้นจึงต้องเฝ้าติดตามข้อมูลจากสหรัฐอเมริกา

Miroslaw Bawulski 11:50 2025-02-28 UTC+2

EUR/USD: แผนการเทรดสำหรับช่วงตลาดสหรัฐฯ วันที่ 28 กุมภาพันธ์ (วิเคราะห์การซื้อขายในช่วงเช้า)

ในการคาดการณ์ช่วงเช้าของฉัน ฉันได้ให้ความสำคัญกับระดับ 1.0404 ซึ่งถือว่าเป็นจุดตัดสินใจสำคัญในการเข้าสู่ตลาด เมื่อดูที่กราฟ 5 นาที จะเห็นว่าราคาขึ้นและมีการทะลุผิดพลาดที่ระดับนี้ ซึ่งเป็นโอกาสให้เข้าสถานะขาย อย่างไรก็ตาม ในขณะที่เขียนบทวิเคราะห์ใหม่นี้ คู่นี้ยังไม่ได้แสดงการเคลื่อนไหวลงอย่างชัดเจน มุมมองทางเทคนิคได้รับการปรับปรุงแล้วสำหรับช่วงครึ่งหลังของวัน การเปิดสถานะ EUR/USD

Miroslaw Bawulski 11:46 2025-02-28 UTC+2

วิธีการเทรดคู่เงิน GBP/USD ในวันที่ 28 กุมภาพันธ์? เคล็ดลับง่ายๆ และการวิเคราะห์การเทรดสำหรับผู้เริ่มต้น

คู่สกุลเงิน GBP/USD ลดลงในวันพฤหัสบดี แม้ว่าจะมีเหตุผลน้อยสำหรับการเคลื่อนไหวนี้ ค่าภาษีนำเข้าของทรัมป์ต่อสหภาพยุโรปไม่ได้ส่งผลกระทบโดยตรงต่อสหราชอาณาจักรที่ออกจากกลุ่มดังกล่าวเมื่อหลายปีก่อน อย่างไรก็ตาม รายงานเกี่ยวกับ GDP ของสหรัฐฯ และคำสั่งซื้อสินค้าคงทนสนับสนุนเงินดอลลาร์ โดยเฉพาะอย่างยิ่ง คำสั่งซื้อสินค้าคงทนเพิ่มขึ้น 3.1% ในเดือนมกราคม ซึ่งเกินกว่าที่คาดการณ์ไว้ที่

Paolo Greco 06:30 2025-02-28 UTC+2

วิธีเทรดคู่สกุลเงิน EUR/USD ในวันที่ 28 กุมภาพันธ์? เคล็ดลับง่ายๆ และการวิเคราะห์การเทรดสำหรับผู้เริ่มต้น

ในวันพฤหัสบดี คู่สกุลเงิน EUR/USD ตอนแรกปรับตัวรวมอยู่ต่ำกว่ากรอบแนวโน้มขาขึ้นก่อนเริ่มเกิดการปรับตัวลดลงตามที่คาดการณ์ไว้ มีหลายปัจจัยที่ส่งผลให้เงินยูโรตกลง ประการแรก มันไม่สามารถทะลุออกจากกรอบแนวราบบนกรอบเวลาในรายวันได้ในระยะเวลาสองอาทิตย์ ประการที่สอง ไม่มีเหตุผลพื้นฐานหรือเศรษฐศาสตร์มหภาคที่สนับสนุนการเติบโตของมัน ประการที่สาม โดนัลด์ ทรัมป์ ประกาศความพร้อมที่จะกำหนดภาษีสินค้าเข้าท้องถิ่น 25% สำหรับการนำเข้าจากสหภาพยุโรป

Paolo Greco 06:30 2025-02-28 UTC+2

คำแนะนำและการวิเคราะห์สำหรับการซื้อขาย GBP/USD เมื่อวันที่ 28 กุมภาพันธ์: ปอนด์ก็เตรียมตกลงเช่นกัน

คู่สกุลเงิน GBP/USD ก็ปรับลดลงในวันพฤหัสบดีเช่นกัน แม้ว่าความผันผวนจะน้อยกว่าคู่สกุลเงิน EUR/USD ส่งผลให้การปรับลงน้อยลงในระดับหนึ่ง ราคามีความยากลำบากในช่วงแรก แต่สุดท้ายก็สามารถทะลุผ่านเส้นแนวโน้มได้ ถึงแม้ว่าจะมีการปรับลดลงที่อ่อนแอกว่า ทัศนะของเราต่อค่าเงินปอนด์อังกฤษยังคงเหมือนเดิม—เราคาดหวังการปรับลดลงต่อเนื่อง สังเกตได้ว่าในบริเวณแนวต้าน 1.2691-1.2701 ยังคงมั่นคง และในช่วงสัปดาห์ที่ผ่านมา ค่าเงินปอนด์ขึ้นเกือบต่อเนื่องโดยไม่มีการปรับฐานอย่างเหมาะสม

Paolo Greco 02:49 2025-02-28 UTC+2

คำแนะนำและการวิเคราะห์การซื้อขายสำหรับ EUR/USD วันที่ 28 กุมภาพันธ์: เงินยูโรเฝ้ารอโอกาสเหมาะแล้วร่วงลง

คู่เงิน EUR/USD ประสบกับการลดลงอย่างมากในวันพฤหัสบดี เป็นเวลามากกว่าสัปดาห์ที่ราคาลอยอยู่ใกล้กับขอบบนของช่องด้านข้างในกรอบเวลารายวัน แต่ก็ไม่เคยทะลุผ่านระดับ 1.0524 ในที่สุด ราคาก็ยืนต่ำกว่าตแนวโน้มขึ้นที่เคยทำหน้าที่เป็นแนวรับมาอย่างยาวนาน เมื่อสิ่งนี้เกิดขึ้น แน่นอนว่ายูโรจะมีทิศทางลดลงอีกครั้ง โดยเฉพาะเมื่อไม่มีปัจจัยพื้นฐานหรือปัจจัยมหภาคที่จะสนับสนุนยูโรในช่วงไม่กี่สัปดาห์ที่ผ่านมา ในช่วงสามวันแรกของสัปดาห์ ไม่มีรายงานสำคัญหรือข่าวสารใด ๆ อย่างไรก็ตาม

Paolo Greco 02:49 2025-02-28 UTC+2

GBP/USD: แผนการซื้อขายสำหรับเซสชั่นสหรัฐอเมริกาในวันที่ 27 กุมภาพันธ์ (รีวิวการซื้อขายช่วงเช้า)

ในบทวิเคราะห์เช้าของฉัน ฉันได้ระบุระดับ 1.2680 เป็นจุดอ้างอิงหลักสำหรับการเข้าสู่ตลาด เมื่อดูจากกราฟ 5 นาที พบว่ามีการเคลื่อนไหวขึ้นแต่ราคายังไม่ถึงระดับ 1.2680 เพื่อเกิดการทะลุหลอก ทำให้ฉันไม่ได้ทำการซื้อขายใดๆ ภาพทางเทคนิคสำหรับช่วงครึ่งหลังของวันยังคงไม่เปลี่ยนแปลง การขาดข้อมูลเศรษฐกิจสำคัญจากสหราชอาณาจักรทำให้ความผันผวนของตลาดลดลงอย่างรวดเร็ว แต่ผู้ซื้อยังคงสามารถผลักดันราคาไปยังแนวต้านที่ 1.2680

Miroslaw Bawulski 15:11 2025-02-27 UTC+2

EUR/USD: แผนการเทรดสำหรับเซสชั่นในสหรัฐอเมริกาวันที่ 27 กุมภาพันธ์ (รีวิวการเทรดช่วงเช้า)

ในการพยากรณ์เมื่อเช้าของฉันได้เน้นย้ำระดับ 1.0491 ว่าเป็นพื้นที่สำคัญสำหรับการตัดสินใจเข้าสู่ตลาด การทบทวนกราฟ 5 นาทีแสดงให้เห็นว่าแม้จะมีการเคลื่อนไหวขึ้น แต่ราคายังไม่ถึงระดับนี้เพื่อสร้างรูปแบบการทะลุปลอม ส่งผลให้ฉันไม่ได้ทำการซื้อขายอีกครั้ง ความผันผวนยังคงน้อยเช่นเดิม ไม่มีการเปลี่ยนแปลงในภาพทางเทคนิคสำหรับช่วงครึ่งหลังของวัน การที่ตลาดไม่ตอบสนองต่อข้อมูลสินเชื่อของยูโรโซนเป็นสิ่งที่คาดการณ์ไว้แล้ว ขณะนี้ความสนใจจะเปลี่ยนไปยังข้อมูลที่สำคัญจากสหรัฐอเมริกา โดยตัวเลข GDP ในไตรมาส

Miroslaw Bawulski 14:50 2025-02-27 UTC+2

วิธีการซื้อขายคู่เงิน GBP/USD ในวันที่ 27 กุมภาพันธ์? เคล็ดลับง่ายๆ และการวิเคราะห์การซื้อขายสำหรับมือใหม่

ในวันพุธ คู่สกุลเงิน GBP/USD พยายามที่จะเคลื่อนไหวขึ้นต่อไป แต่แนวโน้มนี้เริ่มดูเป็นที่น่าสงสัย ก่อนหน้านี้เราได้กล่าวว่าเงินปอนด์จำเป็นต้องปรับตัวขึ้นในกราฟรายวันเนื่องจากปัจจัยทางเทคนิค อย่างไรก็ตามการขึ้นปัจจุบันดูเหมือนจะมากเกินไปและไม่มีเหตุผลสนับสนุน แม้ว่าเมื่อเร็วๆนี้รายงานเศรษฐกิจของสหราชอาณาจักรบางฉบับสนับสนุนเงินปอนด์ มันยังคงอยู่ระดับสูงในสัปดาห์นี้แม้จะไม่มีข่าวดี ในความเป็นจริงไม่ได้มีข้อมูลเศรษฐมหภาคเผยออกมาเลย การเคลื่อนไหวของสัปดาห์นี้ยังคงสะท้อนถึงตลาดที่ราบเรียบ โดยราคาค้าแข้งอยู่ระหว่าง 1.2613 และ 1.2680

Paolo Greco 06:32 2025-02-27 UTC+2

จะเทรดสกุลเงินคู่ EUR/USD ในวันที่ 27 กุมภาพันธ์ได้อย่างไร? เคล็ดลับง่ายๆ และการวิเคราะห์การซื้อขายสำหรับผู้เริ่มต้น

คู่สกุลเงิน EUR/USD ซื้อขายอย่างแบนในวันพุธ โดยทำการฝ่าเส้นแนวโน้มขาขึ้น แต่สิ่งสำคัญคือต้องทราบว่าการฝ่าเส้นแนวโน้มในตลาดที่แบนราบมักเป็นสัญญาณลวงของการกลับตัวของแนวโน้ม แนวโน้มทางเทคนิคในปัจจุบันสำหรับยูโรมีความซับซ้อนมาก ด้านหนึ่ง ราคากำลังเคลื่อนไหวใกล้กับขอบเขตด้านบนของกรอบในแผนภูมิรายวันในช่วงสองสัปดาห์ที่ผ่านมา แต่ในอีกด้านหนึ่ง มันกลับไม่สามารถเพิ่มขึ้นอย่างต่อเนื่อง เนื่องจากสภาวะตลาดยังคงซบเซา คู่สกุลเงินนี้ซื้อขายในลักษณะแบนมาตลอดสัปดาห์ โดยมีการฝ่าเส้นแนวโน้ม ดังนั้นเราขอแนะนำให้มุ่งเน้นไม่ใช่ที่การฝ่าเส้นแนวโน้ม แต่คือที่ระดับ

Paolo Greco 06:32 2025-02-27 UTC+2
หากไม่สะดวกคุยในตอนนี้
ระบุคำถามไว้ได้ใน แชท.
Widget callback
 

Dear visitor,

Your IP address shows that you are currently located in the USA. If you are a resident of the United States, you are prohibited from using the services of InstaFintech Group including online trading, online transfers, deposit/withdrawal of funds, etc.

If you think you are seeing this message by mistake and your location is not the US, kindly proceed to the website. Otherwise, you must leave the website in order to comply with government restrictions.

Why does your IP address show your location as the USA?

  • - you are using a VPN provided by a hosting company based in the United States;
  • - your IP does not have proper WHOIS records;
  • - an error occurred in the WHOIS geolocation database.

Please confirm whether you are a US resident or not by clicking the relevant button below. If you choose the wrong option, being a US resident, you will not be able to open an account with InstaForex anyway.

We are sorry for any inconvenience caused by this message.