signal strength 1 of 5
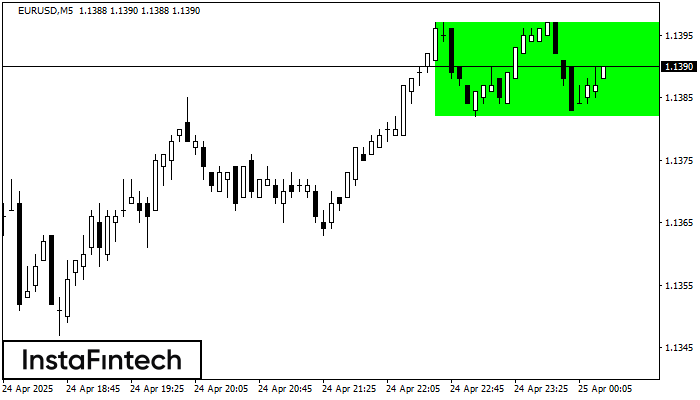
According to the chart of M5, EURUSD formed the Bullish Rectangle. The pattern indicates a trend continuation. The upper border is 1.1397, the lower border is 1.1382. The signal means that a long position should be opened above the upper border 1.1397 of the Bullish Rectangle.
The M5 and M15 time frames may have more false entry points.
- All
- Double Top
- Flag
- Head and Shoulders
- Pennant
- Rectangle
- Triangle
- Triple top
- All
- #AAPL
- #AMZN
- #Bitcoin
- #EBAY
- #FB
- #GOOG
- #INTC
- #KO
- #MA
- #MCD
- #MSFT
- #NTDOY
- #PEP
- #TSLA
- #TWTR
- AUDCAD
- AUDCHF
- AUDJPY
- AUDUSD
- EURCAD
- EURCHF
- EURGBP
- EURJPY
- EURNZD
- EURRUB
- EURUSD
- GBPAUD
- GBPCHF
- GBPJPY
- GBPUSD
- GOLD
- NZDCAD
- NZDCHF
- NZDJPY
- NZDUSD
- SILVER
- USDCAD
- USDCHF
- USDJPY
- USDRUB
- All
- M5
- M15
- M30
- H1
- D1
- All
- Buy
- Sale
- All
- 1
- 2
- 3
- 4
- 5
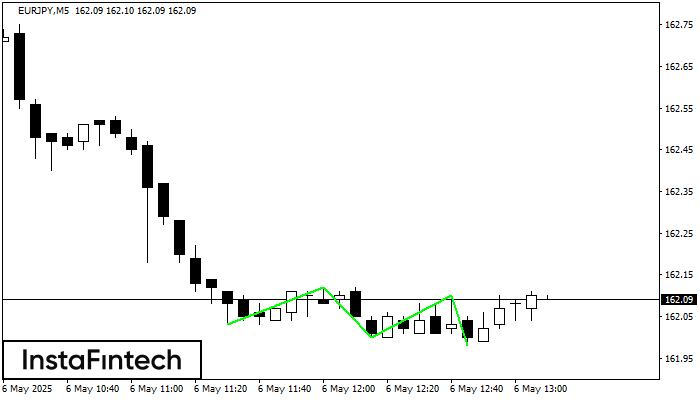
El patrón Triple Piso ha sido formado en el gráfico de EURJPY M5. Características del patrón: línea inferior del patrón tiene coordenadas 162.12 con el límite superior 162.12/162.10, la proyección
Los marcos de tiempo M5 y M15 pueden tener más puntos de entrada falsos.
Open chart in a new window
Según el gráfico de M5, NZDCHF formó el Rectángulo Alcista que es un patrón de la continuación de una tendencia. El patrón está contenido dentro de los siguientes límites
Los marcos de tiempo M5 y M15 pueden tener más puntos de entrada falsos.
Open chart in a new window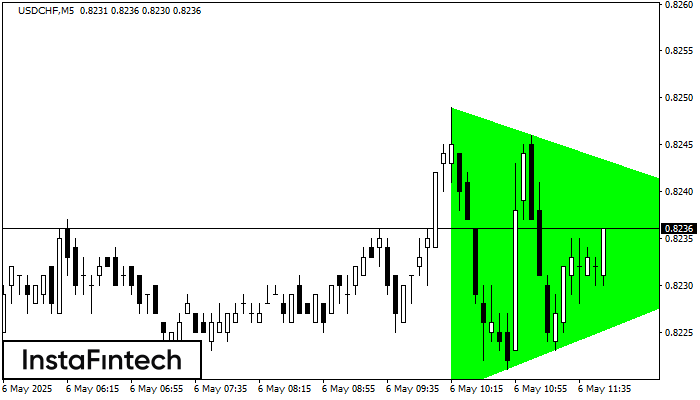
Según el gráfico de M5, el USDCHF formó el patrón Triángulo Simétrico Alcista. El límite inferior del patrón toca las coordenadas 0.8219/0.8235 donde el límite superior cruza 0.8249/0.8235
Los marcos de tiempo M5 y M15 pueden tener más puntos de entrada falsos.
Open chart in a new window