

signal strength 2 of 5
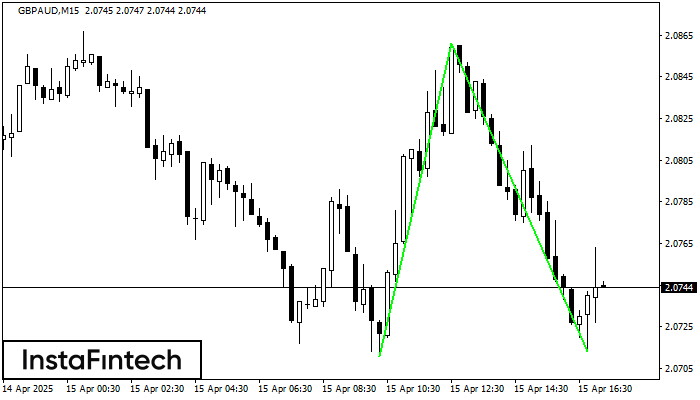
The Double Bottom pattern has been formed on GBPAUD M15. Characteristics: the support level 2.0711; the resistance level 2.0861; the width of the pattern 150 points. If the resistance level is broken, a change in the trend can be predicted with the first target point lying at the distance of 148 points.
The M5 and M15 time frames may have more false entry points.
Vea asimismo
- All
- Double Top
- Flag
- Head and Shoulders
- Pennant
- Rectangle
- Triangle
- Triple top
- All
- #AAPL
- #AMZN
- #Bitcoin
- #EBAY
- #FB
- #GOOG
- #INTC
- #KO
- #MA
- #MCD
- #MSFT
- #NTDOY
- #PEP
- #TSLA
- #TWTR
- AUDCAD
- AUDCHF
- AUDJPY
- AUDUSD
- EURCAD
- EURCHF
- EURGBP
- EURJPY
- EURNZD
- EURRUB
- EURUSD
- GBPAUD
- GBPCHF
- GBPJPY
- GBPUSD
- GOLD
- NZDCAD
- NZDCHF
- NZDJPY
- NZDUSD
- SILVER
- USDCAD
- USDCHF
- USDJPY
- USDRUB
- All
- M5
- M15
- M30
- H1
- D1
- All
- Buy
- Sale
- All
- 1
- 2
- 3
- 4
- 5
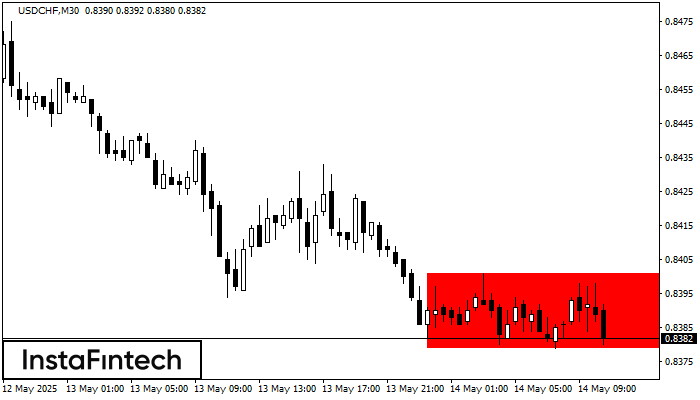
Según el gráfico de M30, USDCHF formó el Rectángulo Bajista que es un patrón de la continuación de una tendencia. El patrón está contenido dentro de los siguientes límites: límite
Open chart in a new window
Según el gráfico de M5, EURJPY formó el patrón Cabeza y Hombros Inverso. El techo de la Cabeza está establecido en 164.66 mientras la línea media del Cuello se encuentra
Los marcos de tiempo M5 y M15 pueden tener más puntos de entrada falsos.
Open chart in a new window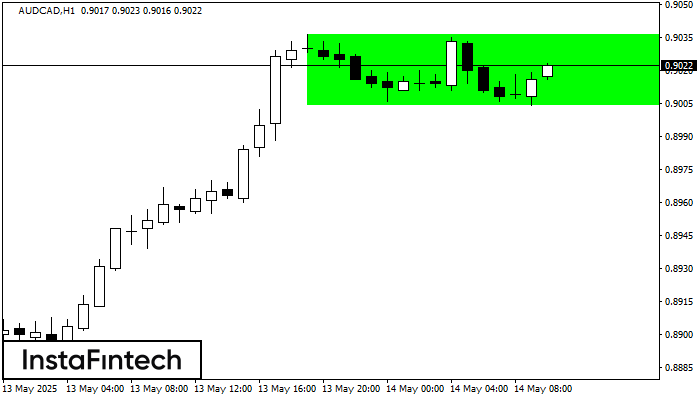
Según el gráfico de H1, AUDCAD formó el Rectángulo Alcista. El patrón indica la continuación de una tendencia. El límite superior es 0.9036, el límite inferior es 0.9004. La señal
Open chart in a new window


