signal strength 4 of 5
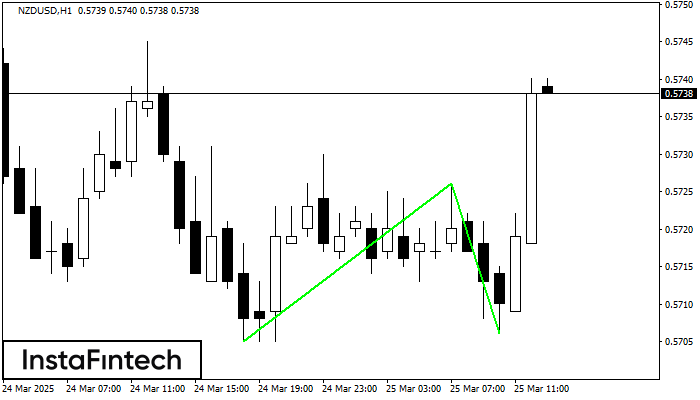
The Double Bottom pattern has been formed on NZDUSD H1. Characteristics: the support level 0.5705; the resistance level 0.5726; the width of the pattern 21 points. If the resistance level is broken, a change in the trend can be predicted with the first target point lying at the distance of 20 points.
- All
- Double Top
- Flag
- Head and Shoulders
- Pennant
- Rectangle
- Triangle
- Triple top
- All
- #AAPL
- #AMZN
- #Bitcoin
- #EBAY
- #FB
- #GOOG
- #INTC
- #KO
- #MA
- #MCD
- #MSFT
- #NTDOY
- #PEP
- #TSLA
- #TWTR
- AUDCAD
- AUDCHF
- AUDJPY
- AUDUSD
- EURCAD
- EURCHF
- EURGBP
- EURJPY
- EURNZD
- EURRUB
- EURUSD
- GBPAUD
- GBPCHF
- GBPJPY
- GBPUSD
- GOLD
- NZDCAD
- NZDCHF
- NZDJPY
- NZDUSD
- SILVER
- USDCAD
- USDCHF
- USDJPY
- USDRUB
- All
- M5
- M15
- M30
- H1
- D1
- All
- Buy
- Sale
- All
- 1
- 2
- 3
- 4
- 5

Según el gráfico de M5, GBPJPY formó el Rectángulo Alcista. El patrón indica la continuación de una tendencia. El límite superior es 193.44, el límite inferior es 193.24. La señal
Los marcos de tiempo M5 y M15 pueden tener más puntos de entrada falsos.
Open chart in a new window
El patrón Triple Piso ha formado en el gráfico del instrumento de negociación EURNZD M5. El patrón señala un cambio en la tendencia de bajista a alcista en caso
Los marcos de tiempo M5 y M15 pueden tener más puntos de entrada falsos.
Open chart in a new window
El patrón de reversión Doble Techo ha sido formado en #Bitcoin M5. Características: el límite superior 103337.20; el límite inferior 102845.36; el ancho del patrón es 51954 puntos. Es mejor
Los marcos de tiempo M5 y M15 pueden tener más puntos de entrada falsos.
Open chart in a new window