signal strength 1 of 5
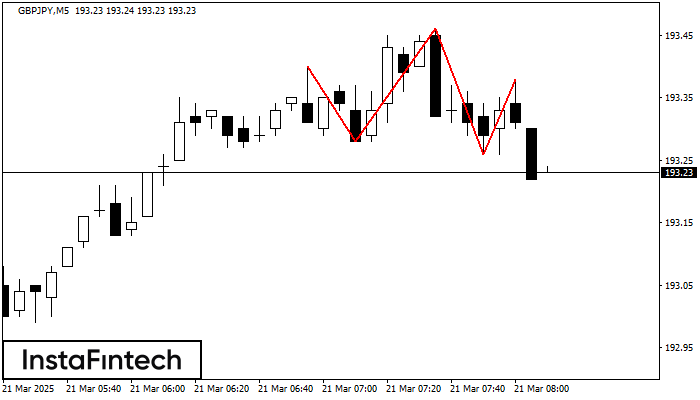
The technical pattern called Head and Shoulders has appeared on the chart of GBPJPY M5. There are weighty reasons to suggest that the price will surpass the Neckline 193.28/193.26 after the right shoulder has been formed. So, the trend is set to change with the price heading for 193.11.
The M5 and M15 time frames may have more false entry points.
- All
- Double Top
- Flag
- Head and Shoulders
- Pennant
- Rectangle
- Triangle
- Triple top
- All
- #AAPL
- #AMZN
- #Bitcoin
- #EBAY
- #FB
- #GOOG
- #INTC
- #KO
- #MA
- #MCD
- #MSFT
- #NTDOY
- #PEP
- #TSLA
- #TWTR
- AUDCAD
- AUDCHF
- AUDJPY
- AUDUSD
- EURCAD
- EURCHF
- EURGBP
- EURJPY
- EURNZD
- EURRUB
- EURUSD
- GBPAUD
- GBPCHF
- GBPJPY
- GBPUSD
- GOLD
- NZDCAD
- NZDCHF
- NZDJPY
- NZDUSD
- SILVER
- USDCAD
- USDCHF
- USDJPY
- USDRUB
- All
- M5
- M15
- M30
- H1
- D1
- All
- Buy
- Sale
- All
- 1
- 2
- 3
- 4
- 5
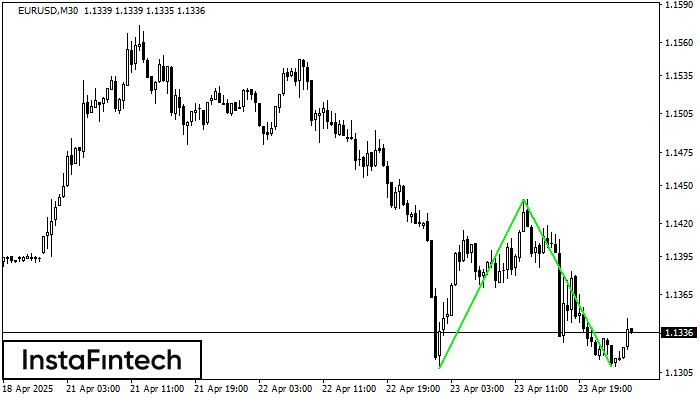
El patrón Doble Piso ha sido formado en EURUSD M30; el límite superior es 1.1439; el límite inferior es 1.1310. El ancho del patrón es 131 puntos. En caso
Open chart in a new window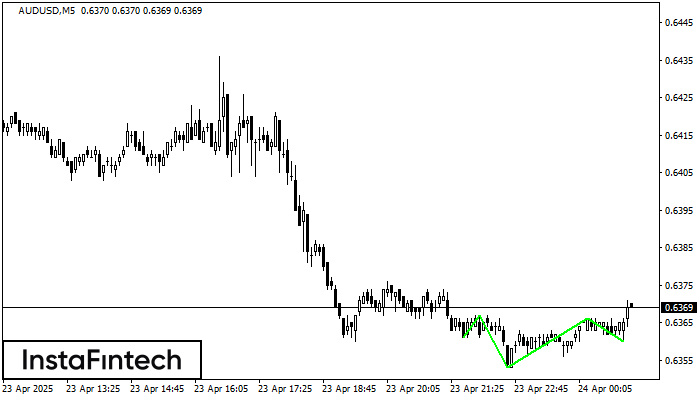
Según el gráfico de M5, AUDUSD formó el patrón Cabeza y Hombros Inverso. El techo de la Cabeza está establecido en 0.6366 mientras la línea media del Cuello se encuentra
Los marcos de tiempo M5 y M15 pueden tener más puntos de entrada falsos.
Open chart in a new window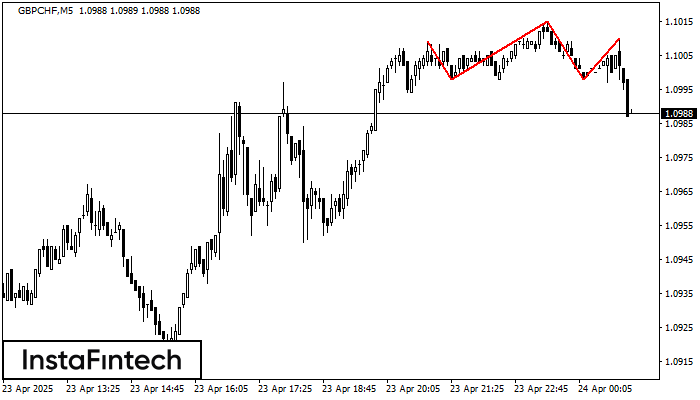
Según el gráfico de M5, GBPCHF formó el patrón. El techo de la Cabeza está establecido en 1.1015 mientras la línea media del Cuello se encuentra en 1.0998/1.0998. La formación
Los marcos de tiempo M5 y M15 pueden tener más puntos de entrada falsos.
Open chart in a new window