Análisis de las operaciones del miercoles:
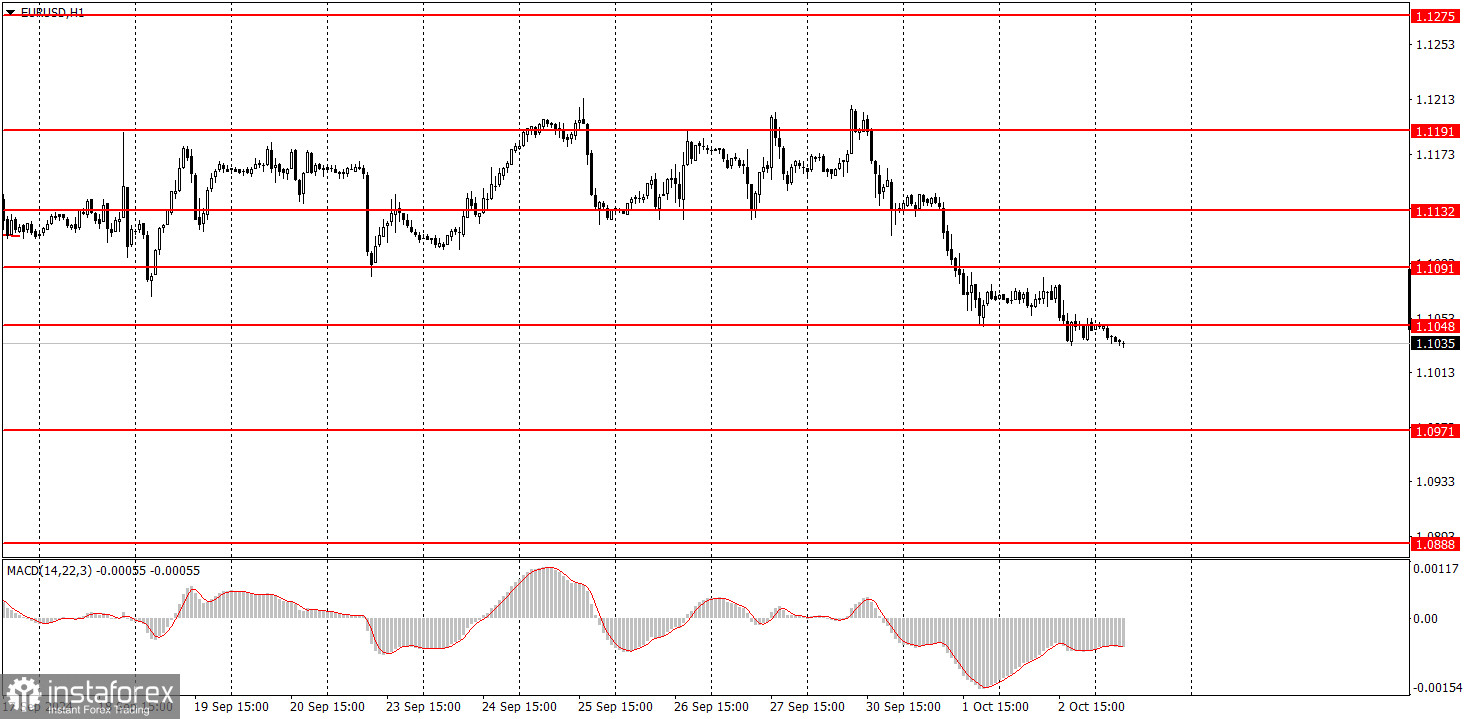
Gráfico 1H del par EUR/USD.
El par de divisas EUR/USD continuó con su lento movimiento bajista el miércoles. Ayer de los acontecimientos macroeconómicos sólo pudimos destacar el informe ADP sobre el número de nuevos empleos en el sector no agrícola, que fue más fuerte que las previsiones de los expertos. Y éste es el tercer indicador importante de los cuatro de esta semana en Estados Unidos, que complació a la divisa norteamericana. Así pues, el nuevo fortalecimiento del dólar en el contexto de su sobreventa generalizada y su desmedida devaluación no nos sorprende en absoluto. Por supuesto, hoy o mañana puede haber una corrección al alza, pero en general esperamos una nueva caída del par EUR/USD.
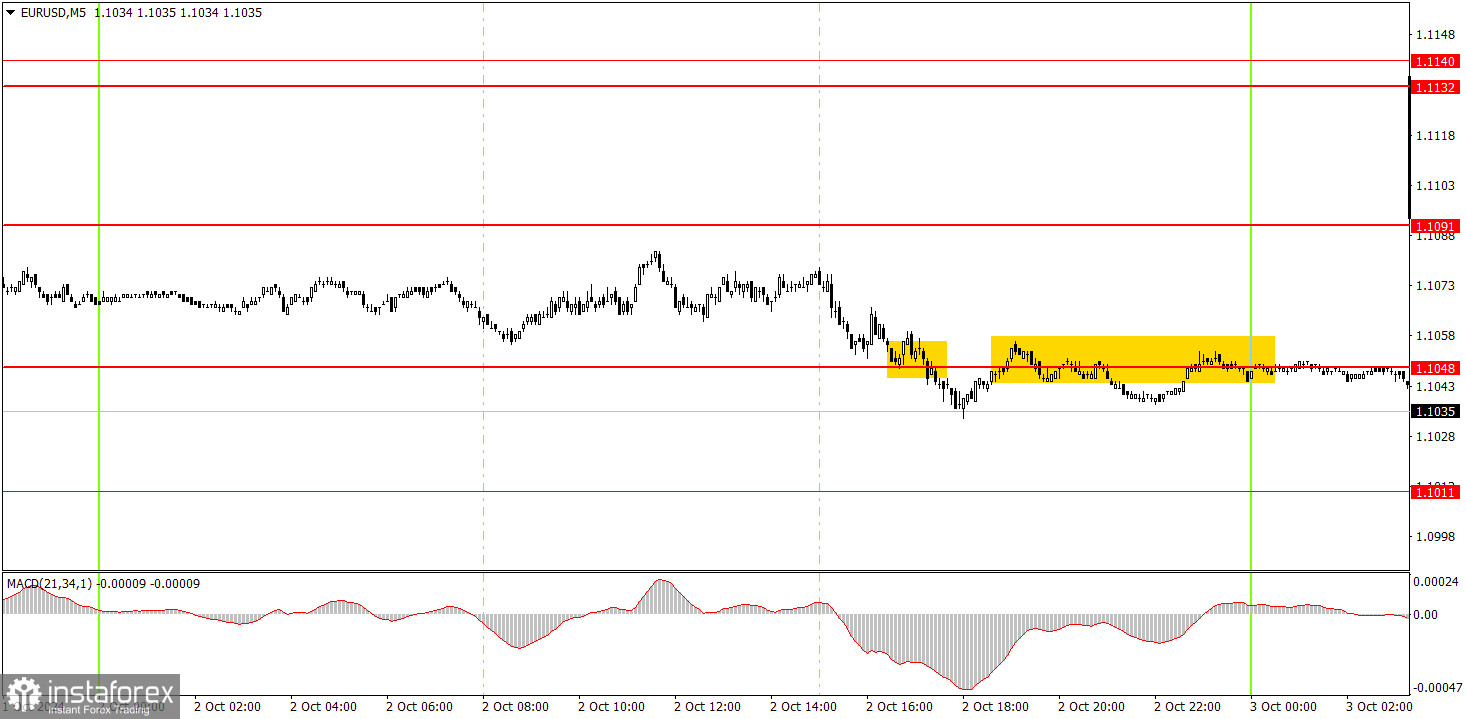
Gráfico de 5M del par EUR/USD.
En el gráfico de 5 minutos del miércoles los movimientos fueron muy débiles, casi de flat. Se formaron varias señales de trading débiles cerca del nivel de 1,1048, pero no fue posible obtener beneficios de ellas, ya que se formaron tarde en el tiempo, y el mercado claramente no era lo suficientemente fuerte. Los participantes en el mercado esperan ahora las estadísticas del viernes en EE.UU. para sacar una conclusión definitiva sobre el estado del mercado laboral en septiembre. Si se observa una tendencia positiva, la probabilidad de que la Fed recorte las tasas un 0,5% en noviembre bajará a 0 y el dólar obtendrá apoyo para las próximas semanas.
Recomendamos leer otros artículos del autor:
Análisis del par EUR/USD. El 3 de octubre. El dólar dio un paso adelante, ¿y ahora qué?
Análisis del par GBP/USD. El 3 de octubre. La libra mostró el habitual retroceso y está a la espera del Nonfarms.
Recomendaciones para operar y análisis de las operaciones con el par EUR/USD para el 3 de octubre.
Recomendaciones para operar y análisis de las operaciones con el par GBP/USD para el 3 de octubre.
Cómo operar el jueves:
En el marco temporal de una hora, el par EUR/USD aún tiene posibilidades de formar una tendencia bajista, y esta semana dio el primer paso en esa dirección. Desgraciadamente, la ilógica venta de dólares podría reanudarse fácilmente a medio plazo, ya que nadie sabe cuánto tiempo más el mercado interpretará la flexibilización monetaria de la Fed e ignorará todos los factores a favor del dólar. Sin embargo, en las dos últimas semanas se ha observado que a los participantes en el mercado ya les está costando empujar el par al alza. Puede que estemos cerca del final de la tendencia alcista, pero esta semana tenemos estadísticas importantes en EEUU.
El jueves es posible operar desde el nivel de 1,1048. El precio ha abandonado el flat, lo que significa que la caída puede continuar. Sin embargo, recuerde que esta semana habrá varios informes más importantes en los EE.UU., que pueden resultar débiles y provocar una nueva caída del dólar.
En el gráfico de 5 minutos deberíamos considerar los niveles de 1,0726-1,0733, 1,0797-1,0804, 1,0838-1,0856, 1,0888-1,0896, 1,0940, 1,0971, 1,1011, 1,1048, 1,1091, 1,1132-1,1140, 1,1189-1,1191, 1,1275-1,1292. El jueves, la Unión Europea y los Estados publicarán sus índices de actividad empresarial de segunda estimación de septiembre para las industrias de servicios. Sin embargo, el más importante será el índice ISM de servicios estadounidense.
Reglas básicas del sistema de negociación
1) La fuerza de la señal se considera por el tiempo que tardó en formarse (rebote o superación de un nivel). Cuanto menos tiempo tarde, más fuerte será la señal.
2) Si dos o más operaciones se abrieron cerca de cualquier nivel en señales falsas, todas las señales posteriores de este nivel deben ser ignoradas.
3) En flat, cualquier par puede formar muchas señales falsas o no formarlas en absoluto. Pero en cualquier caso, es mejor dejar de operar a las primeras señales de flat.
4) Las operaciones se abren en el período comprendido entre el inicio de la sesión europea y la mitad de la sesión americana, después de lo cual todas las operaciones deben cerrarse manualmente.
5) Dependiendo de las señales del indicador MACD, en el marco temporal de una hora conviene operar sólo si hay una buena volatilidad y una tendencia confirmada por una línea de tendencia o un canal de tendencia.
6) Si dos niveles están muy cerca el uno del otro (de 5 a 20 pips), deben ser considerados como soporte o resistencia.
7) Cuando se pasan 15 pips en la dirección correcta, se debe colocar un Stop Loss en el punto de equilibrio.
Qué hay en los gráficos:
Los niveles de precios de soporte y resistencia son niveles que son objetivos para la apertura de compras o ventas. En torno a ellos se pueden colocar niveles de Take Profit.
Líneas rojas - canales o líneas de tendencia, que muestran la tendencia actual y en qué dirección es preferible operar ahora.
Indicador MACD(14,22,3) - histograma y línea de señal - un indicador auxiliar que también se puede utilizar como fuente de señales.
Los discursos e informes importantes (siempre incluidos en el calendario de noticias) pueden influir en gran medida en el movimiento de un par de divisas. Por lo tanto, durante su publicación debe operar con la mayor cautela posible o salir del mercado para evitar un brusco cambio del precio en contra del movimiento anterior.
Los principiantes que operan en el mercado de divisas deben recordar que todas las operaciones no pueden ser rentables. Desarrollar una estrategia clara y una gestión del capital es la clave del éxito en las operaciones a largo plazo.