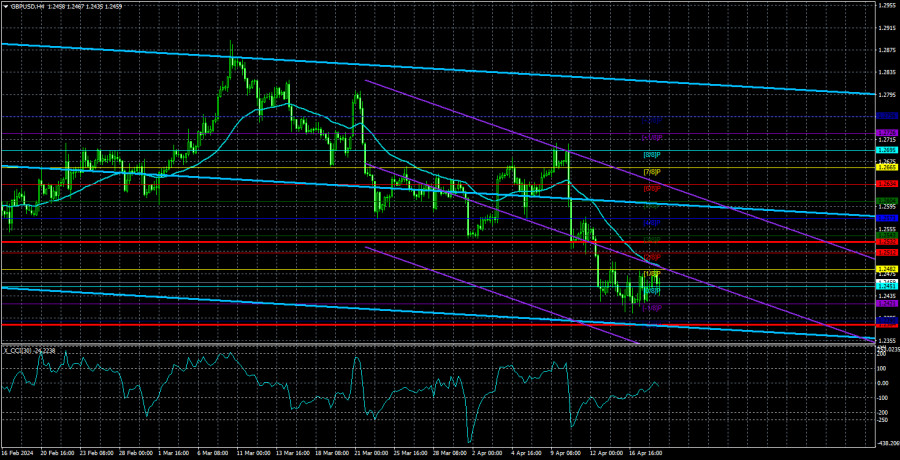
The GBP/USD currency pair remained stagnant on Thursday. In the EUR/USD article, we used the phrase that the British currency "remains flat even after exiting the flat." Let's explain what it means. The British pound traded in a sideways channel of 1.25-1.28 (approximate boundaries) for 4 months. Last week saw the long-awaited breakthrough below the lower boundary; after that, nothing happened. The super-overbought pound still has yet to decline despite the UK economy being in a recession, and the Bank of England might start easing monetary policy much sooner than the market expects. The pound is reluctant to depreciate, despite the excellent condition of the US economy, labor market, and business activity. The market refuses to buy the dollar, despite the Fed's hawkish policy stance and the absence of inflation slowdown overseas.
Thus, the GBP/USD pair is currently trading illogically. In essence, we are still determining the completion of the flat on the 24-hour timeframe. Yes, the pair has exited the sideways channel, but on the 4-hour timeframe, it has been stationary for a week now. Some may argue that this week's macroeconomic backdrop is weak, hence the pair's almost immobilized state. We consider such an opinion erroneous, as at least two events in the past few days should have moved the price off dead center. Inflation in the UK is approaching levels where it would be appropriate for the central bank to start discussing monetary policy easing. Jerome Powell made it clear that any rate cuts in the near future are out of the question.
Even more interesting information emerged on Thursday. Experts from Morgan Stanley said they expect the first easing of monetary policy in the UK in May. It is noted that most market participants expect the first rate cut in September, which may still be earlier than in the US. However, Morgan Stanley experts highlight the optimism of Andrew Bailey in his speech on April 17th, who referred to the current pace of inflation decline as "in line with forecasts." And remember how many times we've said that the Fed can afford to keep rates at the maximum for as long as they want. Still, the Bank of England doesn't have such luxury, as the British economy has already been in negative territory for two consecutive quarters.
As we can see, our words are gaining increasingly realistic meaning. The British regulators may start easing the policy earlier than expected to prevent further economic contraction, which has been experiencing tough times since 2016. The ECB, which avoided recession, waited for inflation to drop to 2.4% and only then began discussing readiness to start the rate-cut cycle. The Bank of England may not wait for such a CPI value and start earlier. The BoE will start cutting rates earlier, and the Fed - much later than the market expected. Thus, the fundamental backdrop still speaks only of the pound's decline. Yet the market or market makers still refuse to sell the GBP/USD pair. Or the Bank of England is conducting hidden interventions to stabilize the pound's exchange rate.

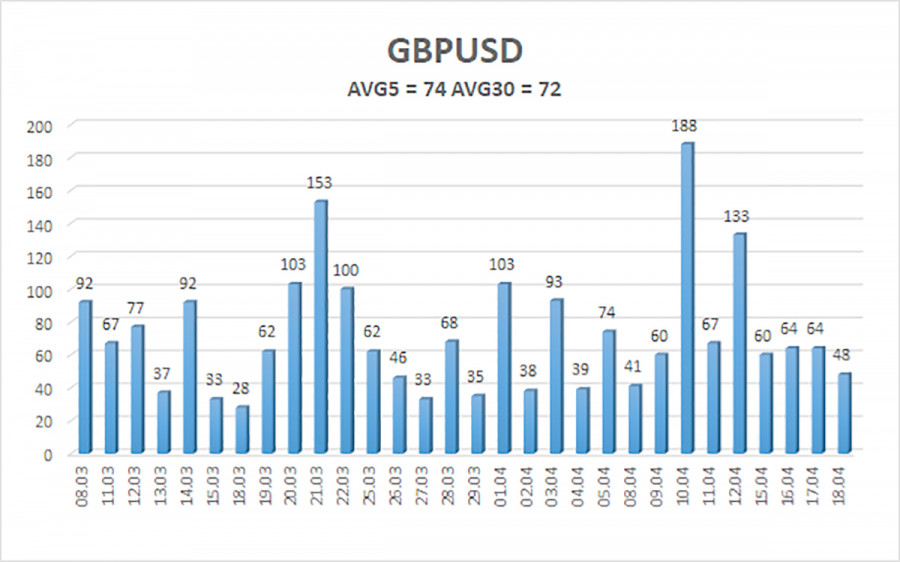
The average volatility of the GBP/USD pair over the last 5 trading days is 74 points. For the pound/dollar pair, this value is considered "average." On Friday, April 19th, we expect movement within the range delimited by the levels 1.2384 and 1.2532. The senior linear regression channel is pointing downward, signalling a descending trend. The CCI indicator entered the oversold zone twice, which may provoke a new rise in the pair. However, completing the 4-month flat remains key now.
Nearest support levels:
S1 - 1.2421
S2 - 1.2390
Nearest resistance levels:
R1 - 1.2451
R2 - 1.2482
R3 - 1.2512
Trading recommendations:
The GBP/USD currency pair presumably completed the flat in the 24-hour timeframe, which is the most important thing. We still expect movement only to the South, and now that the level of 1.2500 has been breached, selling the pair with targets at 1.2384 and 1.2351 can be considered. Buying the British pound in the conditions of the price exiting the sideways channel through the lower boundary is irrelevant. The pair may pull back up soon, as the CCI indicator entered the oversold zone twice, but we do not consider it advisable to trade this correction.
Explanations for illustrations:
Linear regression channels - help determine the current trend. If both point in the same direction, the trend is strong.
The moving average line (settings 20.0, smoothed) - determines the short-term trend and the direction in which trading should be conducted now.
Murray levels - target levels for movements and corrections.
Volatility levels (red lines) - the likely price channel in which the pair will move the next day, based on current volatility indicators.
CCI indicator - its entry into oversold territory (below -250) or overbought territory (above +250) indicates that a trend reversal in the opposite direction is approach


