empty
 
 
08.11.2023 10:45 AM
EUR/USD and GBP/USD: Trading plan for beginner traders on November 8, 2023

Details of the Economic Calendar on November 7

The rate of decline in producer prices in the EU accelerated from -11.5% to -12.4%. These figures turned out to be slightly better than the forecast of -12.6%, but it doesn't change the essence of the situation. Inflation in the EU will continue to decrease at a rapid pace. This means that the ECB interest rates will no longer rise and are expected to decline.

Analysis of Trading Charts from November 7

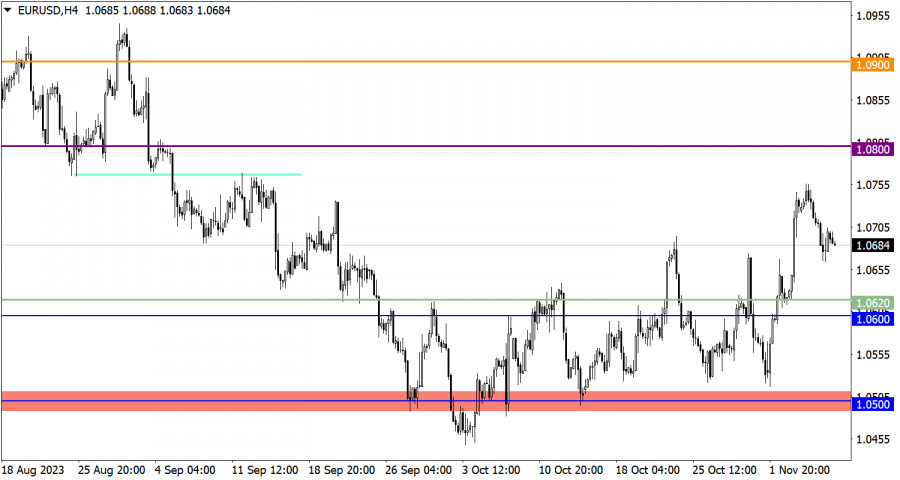
The EUR/USD currency pair continues to follow a downward trend set from the 1.0750 level.

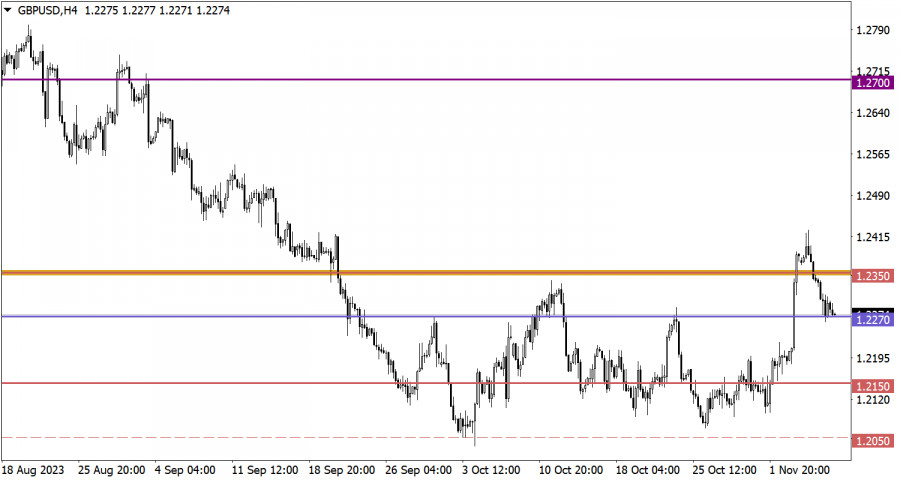
During a technical pullback from the 1.2400 level, GBP/USD dropped to 1.2270. This movement resulted in a partial recovery of the dollar positions.

This image is no longer relevant

Economic Calendar for November 8

Today, the publication of retail sales data in the EU is expected, and the pace of decline may accelerate from -2.1% to -2.8%. If the data is confirmed or turns out worse than expected, the euro exchange rate will decline, dragging the British pound down with it.

EUR/USD Trading Plan for November 8

In the event of a further weakening of the euro, a drop to the 1.0620 level is possible. As for the bullish scenario, the quote needs to return to the 1.0750 level first, indicating a possible increase in the volume of long positions in the euro.

This image is no longer relevant

GBP/USD Trading Plan for November 8

In the case of price stabilization below 1.2270, a subsequent increase in the volume of short positions is possible. In this scenario, the British pound will continue to decline towards the 1.2200 level.

As for the bullish scenario, it will be considered by traders if sellers fail to stay below 1.2270, and this level is played as support.

This image is no longer relevant

What's on the charts

The candlestick chart type is white and black graphic rectangles with lines above and below. With a detailed analysis of each individual candle, you can see its characteristics relative to a particular time frame: opening price, closing price, intraday high and low.

Horizontal levels are price coordinates, relative to which a price may stop or reverse its trajectory. In the market, these levels are called support and resistance.

Circles and rectangles are highlighted examples where the price reversed in history. This color highlighting indicates horizontal lines that may put pressure on the asset's price in the future.

The up/down arrows are landmarks of the possible price direction in the future.

Gana con los cambios en el valor de las criptomonedas con InstaForex.
Descarga MetaTrader 4 y abre tu primera operación.
  • Grand Choice
    Contest by
    InstaForex
    InstaForex always strives to help you
    fulfill your biggest dreams.
    UNIRSE AL CONCURSO
  • Depósito al azar
    ¡Haga un depósito en su cuenta de $3,000 y obtenga $1000 más!
    ¡En Octubre, sorteamos $1000 dentro de la campaña Depósito afortunado!
    Obtenga la oportunidad de ganar depositando $3,000 en una cuenta de operaciones. Tras haber cumplido esta condición, se convertirá en un participante de la campaña.
    UNIRSE AL CONCURSO
  • Opere de forma inteligente, gane un dispositivo
    Recargue su cuenta con al menos $500, regístrese en el concurso y tenga la oportunidad de ganar dispositivos móviles.
    UNIRSE AL CONCURSO
  • 100% de bonificación
    Su oportunidad única de obtener un bono del 100 % en su depósito
    OBTENER BONO
  • 55% de bonificación
    Solicite un bono del 55% en cada depósito
    OBTENER BONO
  • 30% de bonificación
    Reciba un bono del 30% cada vez que recargue su cuenta
    OBTENER BONO

Recommended Stories

¿No puede hablar ahora mismo?
Ingrese su pregunta en el chat.
Widget callback