empty
17.01.2023 11:25 AM
EUR/USD and GBP/USD trading plan for beginners on January 17, 2023

Details of the economic calendar on January 16

The economic calendar was traditionally empty on Monday. No important reports were published in the EU, the United Kingdom, and the Unites States.

Martin Luther King Day was celebrated in the United States. For this reason, banks, funds, and stock exchanges were closed.

Analysis of trading charts from January 16

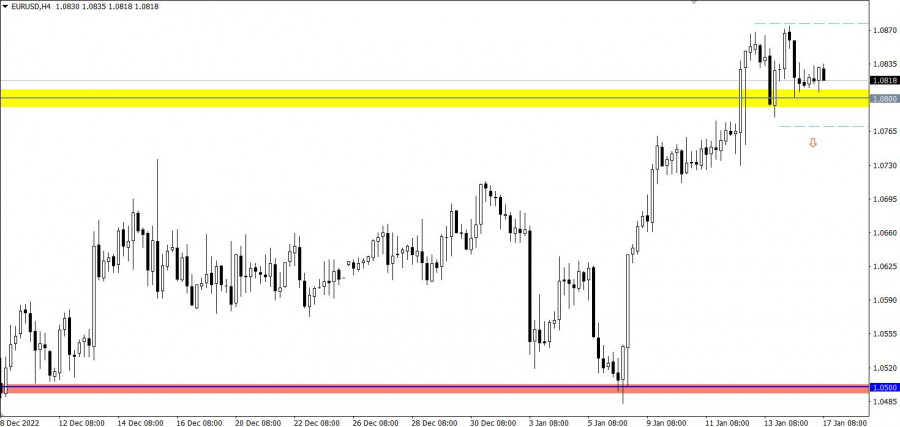
EURUSD reached the 1.0800 level during the pullback stage, where there was an amplitude move within 70 pips. In fact, the market remains in an upward mood, otherwise there would be a full-blown correction.

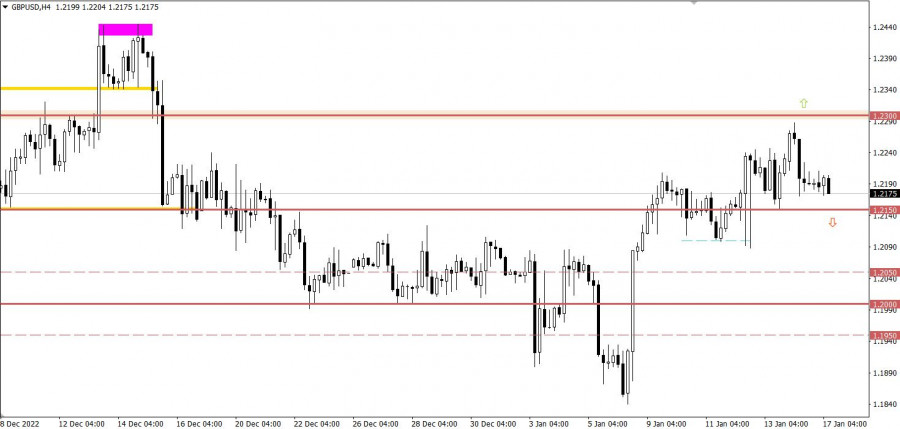
GBPUSD reduced the volume of long positions during the price convergence with the 1.2300 resistance level. As a result, there was a pullback of about 100 pips, which eventually turned into a stagnation.

This image is no longer relevant

Economic calendar for January 17

Since the opening of the European session, data on the UK labor market have been published, which came out without any fundamental changes. Unemployment in the country remained at 3.6%. Employment increased by 27,000, while jobless claims rose by 19,700.

Expectations coincided with the forecast; there is no reaction in the market.

EUR/USD trading plan for January 17

Presumably, the 1.0800/1.0870 amplitude will focus the market on itself only for a while. As a result, the stagnation will end with an impulse emanating from the stagnation, which will indicate one of the possible scenarios.

The first scenario considers the prolongation of the current upward cycle in the market in case of a stable holding of the price above the value of 1.0880 in a four-hour period.

The second scenario considers the transition from a pullback stage to a full correction if the price holds below 1.0770 in a four-hour period.

This image is no longer relevant

GBP/USD trading plan for January 17

Stagnation possibly serves as a process of accumulation of trading forces, which can become a lever for new price jumps. The 1.2150 level serves as a variable support, while the resistance is at 1.2300.

In this situation, cardinal changes will occur only after the price stays outside one or another control level for at least a four-hour period.

This image is no longer relevant

What's on the charts

The candlestick chart type is white and black graphic rectangles with lines above and below. With a detailed analysis of each individual candle, you can see its characteristics relative to a particular time frame: opening price, closing price, intraday high and low.

Horizontal levels are price coordinates, relative to which a price may stop or reverse its trajectory. In the market, these levels are called support and resistance.

Circles and rectangles are highlighted examples where the price reversed in history. This color highlighting indicates horizontal lines that may put pressure on the asset's price in the future.

The up/down arrows are landmarks of the possible price direction in the future.

Summary
Urgency
Analytic
Vladislav Tukhmenev
Start trade
Gana con los cambios en el valor de las criptomonedas con InstaForex.
Descarga MetaTrader 4 y abre tu primera operación.
  • Grand Choice
    Contest by
    InstaForex
    InstaForex always strives to help you
    fulfill your biggest dreams.
    UNIRSE AL CONCURSO

Recommended Stories

GBP/USD plan para la sesión europea del 17 de julio. Informes Commitment of Traders COT (análisis de las operaciones de ayer). La libra esterlina tuvo mucha suerte

Ayer se formaron varios puntos de entrada al mercado. Veamos el gráfico de 5 minutos y analicemos lo que ocurrió. En mi pronóstico matutino presté atención al nivel 1.3376

Miroslaw Bawulski 07:19 2025-07-17 UTC+2

EUR/USD plan para la sesión europea del 17 de julio. Informes Commitment of Traders COT (análisis de las operaciones de ayer). La presión sobre el jefe de la Fed de EE. UU. afecta negativamente al dólar

EUR/USD plan para la sesión europea del 17 de julio. Informes Commitment of Traders COT (análisis de las operaciones de ayer). La presión sobre el jefe

Miroslaw Bawulski 07:19 2025-07-17 UTC+2

Cómo operar con el par EUR/USD el 16 de julio. Consejos simples y análisis de operaciones para principiantes.

El par de divisas EUR/USD se desplomó bruscamente el martes en medio del informe sobre la inflación estadounidense. Como se suele decir, nada presagiaba el problema. Durante varios días consecutivos

Paolo Greco 07:54 2025-07-16 UTC+2

GBP/USD plan para la sesión europea del 16 de julio. Informes Commitment of Traders COT (análisis de las operaciones de ayer). Con la libra esterlina todo va mal

Ayer solo se formó un punto de entrada al mercado. Veamos el gráfico de 5 minutos y analicemos qué ocurrió. En mi pronóstico de la mañana presté atención al nivel

Miroslaw Bawulski 07:54 2025-07-16 UTC+2

EUR/USD plan para la sesión europea del 15 de julio. Informes Commitment of Traders COT (análisis de las operaciones de ayer). La inflación en EE.UU. aumentó

Ayer no llegué a ver condiciones adecuadas para entrar al mercado. Veamos el gráfico de 5 minutos y analicemos lo que ocurrió. En mi pronóstico de la mañana, presté atención

Miroslaw Bawulski 07:54 2025-07-16 UTC+2

GBP/USD plan para la sesión europea del 15 de julio. Informes Commitment of Traders COT (análisis de las operaciones de ayer). La libra esterlina continúa cayendo activamente

Ayer se formaron varios puntos de entrada al mercado. Veamos el gráfico de 5 minutos y analicemos lo que ocurrió. En mi pronóstico de la mañana presté atención al nivel

Miroslaw Bawulski 07:08 2025-07-15 UTC+2

EUR/USD plan para la sesión europea del 15 de julio. Informes Commitment of Traders COT (análisis de las operaciones de ayer). El euro mantiene sus posiciones

Ayer se formó solo un punto de entrada al mercado. Propongo echar un vistazo al gráfico de 5 minutos y analizar lo que ocurrió. En mi pronóstico de la mañana

Miroslaw Bawulski 07:08 2025-07-15 UTC+2

EUR/USD: plan para la sesión europea del 14 de julio. Informes Commitment of Traders COT (análisis de las operaciones de ayer). El euro quedó bajo presión

El pasado viernes solo se formó un punto de entrada al mercado. Veamos el gráfico de 5 minutos y analicemos lo que ocurrió allí. En mi pronóstico de la mañana

Miroslaw Bawulski 08:21 2025-07-14 UTC+2

GBP/USD: plan para la sesión europea del 11 de julio. Informes Commitment of Traders COT (análisis de las operaciones de ayer). La libra esterlina volvió al mínimo semanal

Ayer se formaron varios puntos de entrada al mercado. Veamos el gráfico de 5 minutos y analicemos lo que ocurrió. En mi pronóstico de la mañana presté atención al nivel

Miroslaw Bawulski 08:06 2025-07-11 UTC+2

EUR/USD: plan para la sesión europea del 11 de julio. Informes Commitment of Traders COT (análisis de las operaciones de ayer). El euro volvió a caer

Ayer se formaron varios puntos de entrada al mercado. Veamos el gráfico de 5 minutos y analicemos lo que ocurrió. En mi pronóstico de la mañana presté atención al nivel

Miroslaw Bawulski 08:06 2025-07-11 UTC+2
¿No puede hablar ahora mismo?
Ingrese su pregunta en el chat.
Widget callback
 

Dear visitor,

Your IP address shows that you are currently located in the USA. If you are a resident of the United States, you are prohibited from using the services of InstaFintech Group including online trading, online transfers, deposit/withdrawal of funds, etc.

If you think you are seeing this message by mistake and your location is not the US, kindly proceed to the website. Otherwise, you must leave the website in order to comply with government restrictions.

Why does your IP address show your location as the USA?

  • - you are using a VPN provided by a hosting company based in the United States;
  • - your IP does not have proper WHOIS records;
  • - an error occurred in the WHOIS geolocation database.

Please confirm whether you are a US resident or not by clicking the relevant button below. If you choose the wrong option, being a US resident, you will not be able to open an account with InstaForex anyway.

We are sorry for any inconvenience caused by this message.