Details of the economic calendar for August 30
Data on the lending market in the UK came out better than expected, which served as a stimulus for the growth in the value of the British currency at the time of publication of statistics.
Details:
The number of approved mortgage loans in July turned out to be 63,770 against 63,180 in the previous month. Forecast assumed 61,730.
Mortgage lending slightly fell to £5.1 billion, although forecasts assumed £4.7 billion.
During the American session, data on housing prices in the United States were published, where forecasts coincided with a decline in indicators. However, data on JOLTS open vacancies for July significantly rose to 11.2 million against the forecast of 10.475 million and against 11.040 million earlier. Such strong statistics limit the regulator's maneuvers, and there is still a long way to go before the end of monetary policy tightening.
Category "Interesting moments"
Yesterday there were a lot of comments from representatives of the ECB and the Fed, which are worth paying attention to, because they form a common opinion on the further actions of regulators.
Vasle (ECB):
- inflation could be well above target in 2023
- the peak of inflation in the EU has not yet passed; inflation is expected to decrease in 2023
- supports ECB interest rate increase by more than 0.5% in SeptemberKnot (ECB):
- economic recession in the EU at the end of this year is inevitable
- not sure that raising the ECB rate to a neutral level (1-2%) is enough
- in favor of raising the ECB interest rate by 0.75% in September
Lane (ECB):
- considering the possibility of raising the interest rate to 0.5% or 0.75% in September
Muller (ECB):
- ECB should discuss a 0.75% interest rate hike in September
Bostic (Fed):
- Inflation remains high; The regulator has not yet finished with the increase in interest rates
- there is a risk of a recession in the United States amid attempts by the regulator to reduce inflation to the target of 2%
Williams (Fed):
- it is necessary to raise the Fed's real rate > 0
- it is necessary to raise the rate above the long-term neutral level (2-3%)
- prefers a rate slightly > 3.5%
- it will take several years to bring inflation back to the target 2%
- advocates raising and maintaining rates at a high level in 2023
Analysis of trading charts from August 30
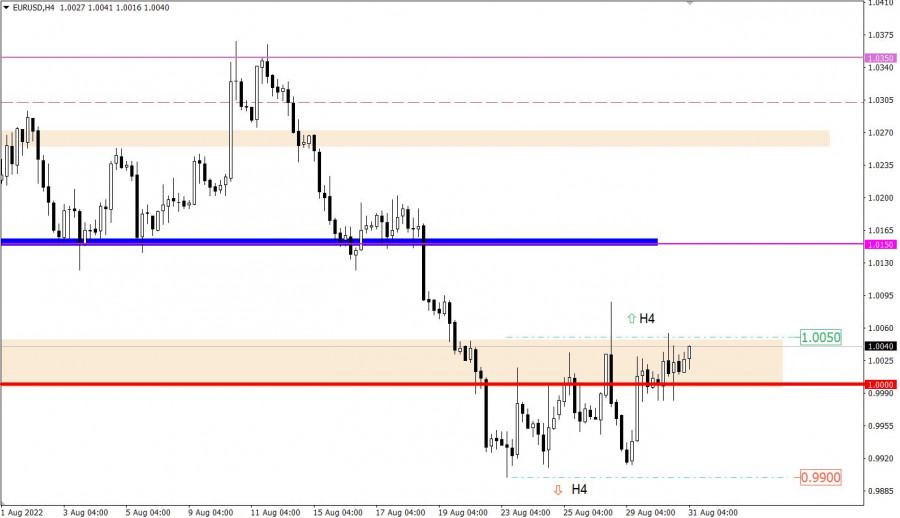
The EURUSD currency pair was conditionally standing in one place throughout the day. The movement took place between the parity level and the variable value of 1.0050. In fact, there was a process of accumulation of trading forces on the market, where traders took a break, which in the end can become a lever for speculative jumps.
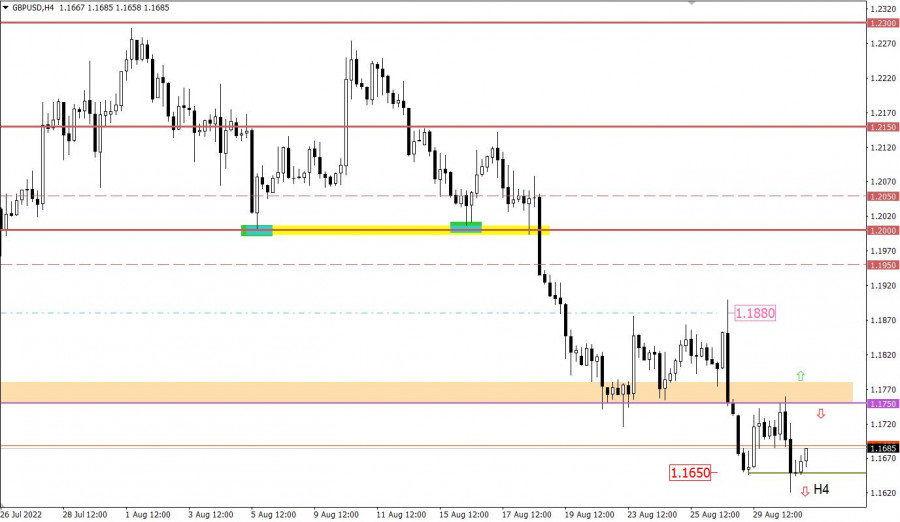
The GBPUSD currency pair behaves most interestingly in comparison with the euro. The quote locally updated the low of the downward trend, but the market participants failed to keep below the control value of 1.1650, reducing the volume of short positions resulting in a pullback.
Economic calendar for August 31
Today, the market will focus on preliminary data on inflation in Europe, which, based on the forecast, may accelerate from 8.9% to 9.1%. This means that the ECB will actively raise interest rates, which will be the reason for the euro exchange rate.
No less important statistics will be published during the American trading session. Speculators will definitely be interested in the ADP report on employment in the United States, which is forecasted to grow by 200,000.
Time targeting:
EU Inflation – 09:00 UTC
ADP Report – 12:15 UTC
Trading plan for EUR/USD on August 31
Despite the existing stagnation, the quote is still moving within the sideways range of 0.9900/1.0050. For this reason, the main decisions will be made by traders after one of the values of the current range is broken.
We concretize the above:
The upward move in the currency pair is taken into account after holding the price above the value of 1.0050 in a four-hour period.
A downward trend should be considered after holding the price below 0.9900 in a four-hour period.
Trading plan for GBP/USD on August 31
In this situation, the level of 1.1650 still puts pressure on sellers, which may lead to the subsequent formation of a pullback, following the example of August 29. In this case, the quote may return to the level of 1.1750.
Traders will consider the downside scenario after the price holds stable below 1.1650 for at least a four-hour period.
Under this scenario, movement towards the local low of 2020 is not excluded.
What is shown in the trading charts?
A candlestick chart view is graphical rectangles of white and black light, with sticks on top and bottom. When analyzing each candle in detail, you will see its characteristics of a relative period: the opening price, closing price, and maximum and minimum prices.
Horizontal levels are price coordinates, relative to which a stop or a price reversal may occur. These levels are called support and resistance in the market.
Circles and rectangles are highlighted examples where the price of the story unfolded. This color selection indicates horizontal lines that may put pressure on the quote in the future.
The up/down arrows are the reference points of the possible price direction in the future.


