empty
 
 
Padrão Triângulo

Padrão Triângulo

Os triângulos estão entre os padrões gráficos mais populares usados na análise técnica. Esta combinação de velas pode ser encontrada na maioria dos instrumentos financeiros e em qualquer período. Os triângulos se enquadram na categoria de padrões de continuação, o que significa que é precedido pela tendência, seja de alta ou de baixa.

Triangles are among the most popular chart patterns used in technical analysis. This candlestick combination can be found on most financial instruments and on any time frame. Triangles fall under the category of continuation patterns, meaning that it is preceded by the trend, either bullish or bearish one. The pattern is formed amid market uncertainty when interests of bears are counterbalanced by interests of bulls i.e. when the market is determining its direction.

To build a triangle, you need to find at least four points: two points to plot a trend line based on candlestick highs and two dots to plot a trend line based on candlestick lows. When there is consolidation on the chart, price fluctuation diminishes and the pattern can be identified. When support and resistance lines intersect, the candlestick formation called a triangle is completed.

Ascending, descending and symmetrical triangles

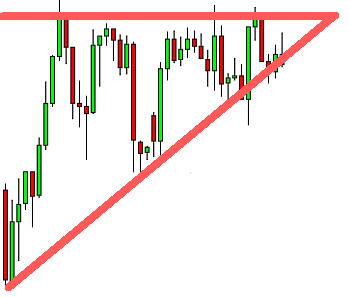
There are three types of the price pattern: the ascending triangle, the descending triangle and the symmetrical triangle. The ascending triangle emerges after the uptrend and is directed upwards:

Padrão Triângulo

Fig.1. Ascending triangle pattern

Meanwhile, the line built on price highs is horizontal (which is a line of resistance) or is directed slightly upwards. Consequently, the bottom line built on price lows is directed upwards and intersects with the horizontal line. In case the price breaks out the resistance line, the uptrend will continue. However, the price can fall below the bottom line. Then, a price decline should be expected. But, most likely, this will be the triple top pattern, a reversal pattern, which is often confused with a triangle.

The descending triangle is directed downwards. It is characterized by the following direction of lines: the top line plotted on price highs is inclined downwards, while the bottom line plotted on price lows is horizontal or also slightly directed downwards.

When the price crosses above the bottom line, the continuation of the downtrend should be expected.

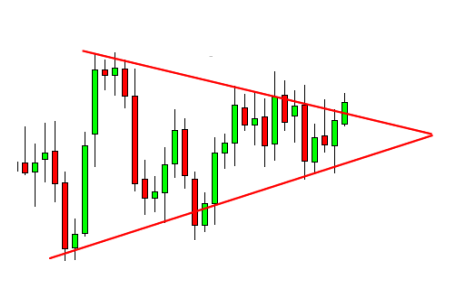
In case of the symmetrical triangle, both trend lines are inclined towards the center of formation. The breakout of the pattern usually occurs in the direction of the previous trend. This is the most predictable continuation pattern:

Padrão Triângulo

Fig. 2. Symmetrical triangle pattern

Trading triangle patterns

There are three ways of market entry when the triangle pattern is forming:

1. Following the price’s breakout of the triangle’s trend line, there is an opportunity of a market entry in the direction of the breakout. Meanwhile, it is better to wait until the breakout candlestick is closed. This is the riskiest way of a market entry.

2. For a safer entry, a trader should wait for the moment when the pattern’s breakout line is retested.

3. The price should retest the high or low reached between the lines. This is the least risky option and despite the fact that the profit may be less at such an entry, there is a bigger chance that you will be in-the-money.

A trader should take into account the fact that the triangle pattern becomes less reliable when the price approaches the point of the lines’ intersection. The best breakouts occur at 50-75% of the triangle completion.

The take profit target goes the same distance away as the one between two most distant points connected by the vertical line of the triangle. The second way of taking profit is to plot a parallel line opposite to the line broken by the price. When the price touches this parallel line, the trade is closed with profit taking.

The stop loss is placed at the highest level for the descending pattern or at the lowest for the ascending formation. However, there is an option to place the stop loss at the lower low/high in case of the symmetrical triangle or if one of the lines is inclined towards the trend continuation. Trade the triangle pattern with caution as there are high odds that it is confused with the reversal pattern. But if it is correctly defined and a trade is properly entered, a trader can count on solid profits.

Actual patterns

Não pode falar agora?
Faça sua pergunta no chat.
Widget callback