EUR/USD 5-Minute Analysis
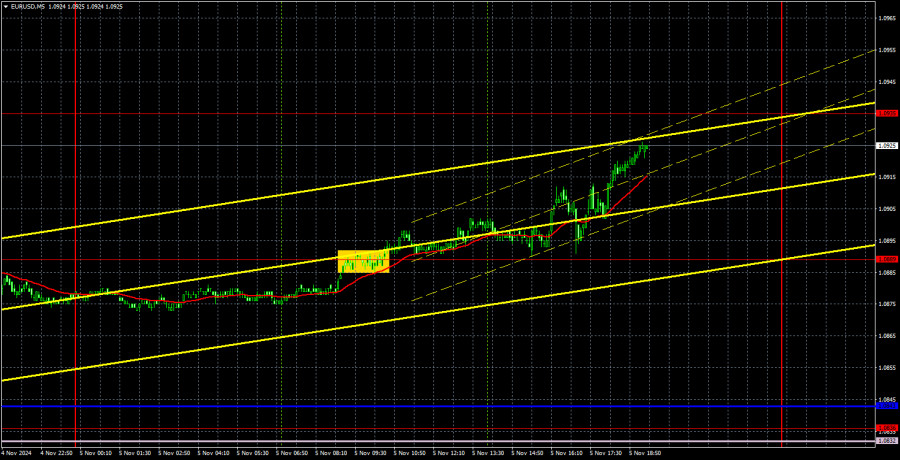
The EUR/USD currency pair unexpectedly showed an upward movement on Tuesday. However, there's no reason to be surprised by this movement since an upward correction is underway, and the U.S. presidential elections have started. We warned that this week might see many inexplicable movements, and Tuesday proved that true. It's challenging to say what the market is preparing for or which candidate it is betting on more heavily. The latest polls indicate no clear lead for either Kamala Harris or Donald Trump, making these movements unpredictable. Nonetheless, we believe the correction will end, and the market will return to the downtrend.
It's also worth noting that Tuesday's key report—the ISM services PMI—was ignored. The report exceeded forecasts, which should have supported the dollar, but the market is now entirely focused on the elections, the Federal Reserve meeting, and the Bank of England meeting. These unpredictable movements have started and may continue through the end of the week.
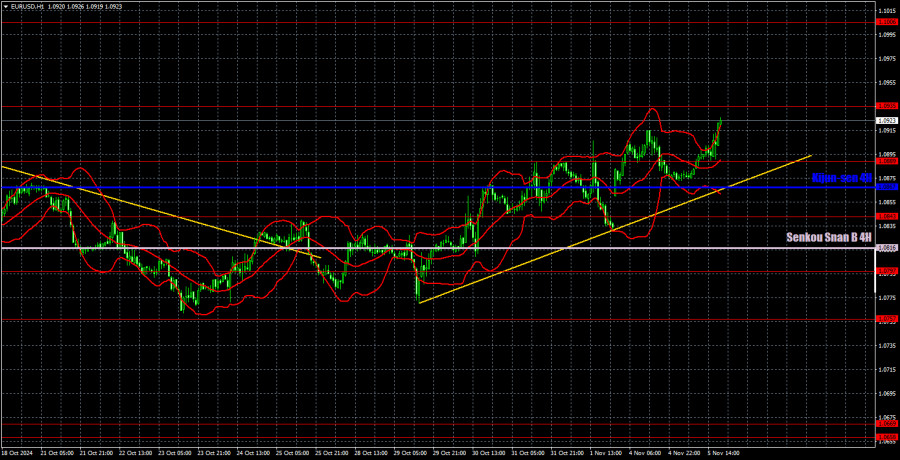
At this point, we have an ascending trend line, so there's no reason to sell the pair, at least in the short term. We should expect the primary trend to resume and consider selling options only after breaking below the trend line.
On Tuesday, there was precisely one trade signal. During the European session, the price broke above the 1.0889 level, which traders could have used for buying. By the end of the day, the pair reached the 1.0935 level, where profits could be taken. Since there are no signs of the correction ending, staying in long positions is possible. But volatility may spike today and tomorrow, with prices potentially swinging in both directions.
COT Report
The latest COT report, dated October 29, shows that the net position of non-commercial traders has remained bullish for a long time, with the bears' latest attempt to gain control failing spectacularly. However, two weeks ago, the number of short positions opened by professional traders increased sharply, and the net position became negative for the first time in a long while. This indicates that the euro is now being sold more frequently than bought.
We still see no fundamental factors supporting the euro's strength, while technical analysis shows the price in a consolidation zone—essentially, a flat trend. Regarding the weekly time frame, it is clear that the pair has been trading between the 1.0448 and 1.1274 levels since December 2022. In other words, a seven-month flat has extended to 18 months, making further decline more likely—at least down to the 1.0448 level.
The red and blue lines have crossed and switched positions relative to each other. In the last reporting week, the number of longs in the non-commercial group rose by 6,100, while shorts increased by 27,900, reducing the net position by 21,800. There is still strong potential for the euro's decline.
EUR/USD 1-Hour Analysis
The pair started an upward correction within a downtrend on the hourly time frame. There's little reason to discuss fundamental and macroeconomic grounds for a new decline in the dollar—they don't exist. In the medium term, we expect nothing but a decline in the euro. The short-term outlook is for a correction, the strength of which will largely depend on the Fed meeting this week. The market may also react strongly to the election results, which could be known by the end of the week.
For November 6, we have identified the following trading levels: 1.0658-1.0669, 1.0757, 1.0797, 1.0843, 1.0889, 1.0935, 1.1006, 1.1092, and 1.1147, along with the Senkou Span B line (1.0816) and Kijun-sen line (1.0867). The Ichimoku indicator lines may shift throughout the day, which should be considered when identifying trading signals. Remember to set a Stop Loss order to break even if the price moves 15 pips in the intended direction. This will protect against potential losses if the signal proves false.
On Wednesday, another speech by Christine Lagarde is scheduled in the Eurozone, but there are no major events in the U.S. While Lagarde made no significant comments on Tuesday, the market will entirely focus on the elections today.
Chart Explanations:
Support and resistance levels: thick red lines around which movement may end. They are not sources of trading signals.
Kijun-sen and Senkou Span B lines: Ichimoku indicator lines transferred from the 4-hour to the 1-hour timeframe. These are strong lines.
Extreme levels: thin red lines where the price previously rebounded. They are sources of trading signals.
Yellow lines: Trend lines, trend channels, and other technical patterns.
Indicator 1 on COT charts: The net position size for each category of traders.


