Analysis of Monday's Trades:
EUR/USD on 1H Chart
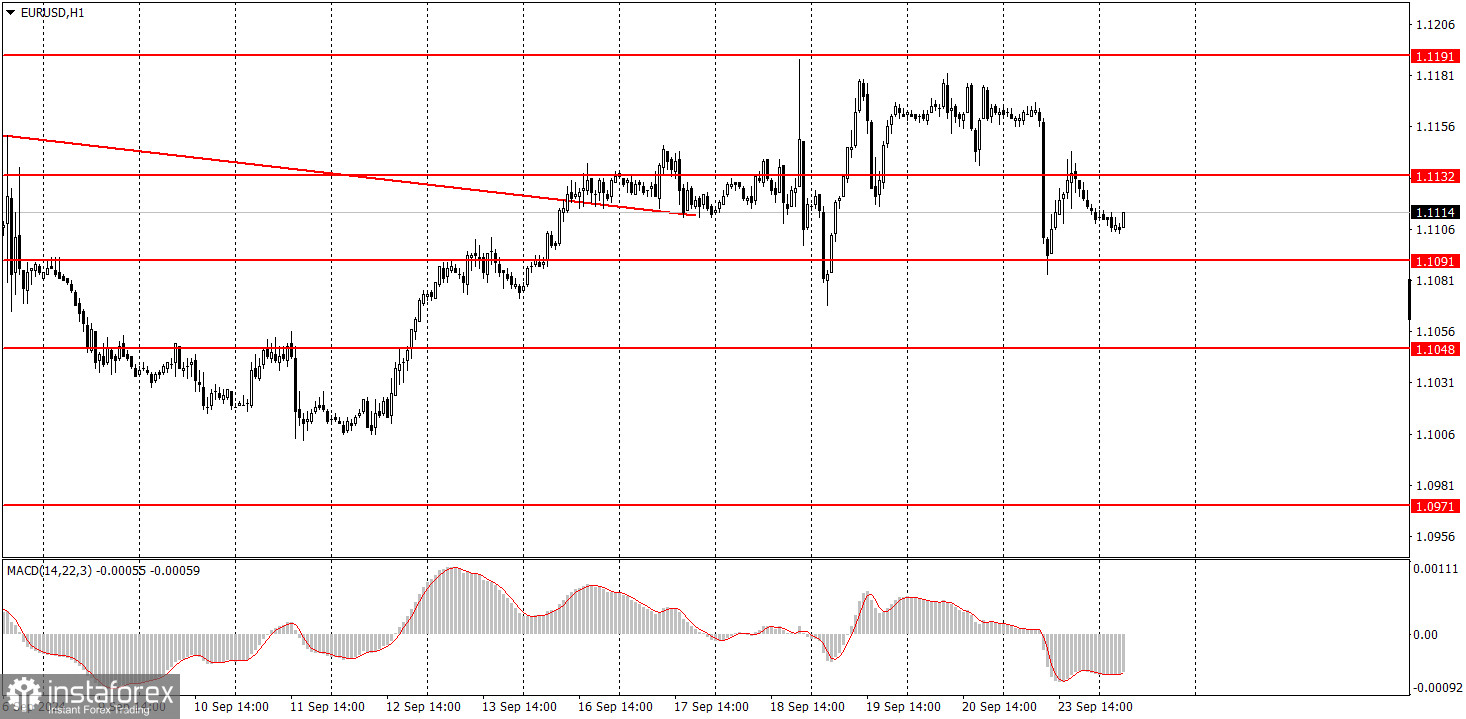
The EUR/USD pair exhibited highly volatile movements on Monday, which, to put it mildly, we did not expect. Out of nowhere, the pair started to experience a nearly precipitous decline in the morning, even before the release of the business activity reports in Germany and the Eurozone. As a result, these reports did turn out to be weaker than forecast, making the euro's decline seem logical—if it weren't for one caveat: it began an hour before the indices were released. Therefore, either a particular segment of the market had access to information about business activity earlier than the majority, or the euro's decline was unrelated to the reports.
In any case, the euro didn't fall for long. Almost an hour later, the recovery began, and the morning decline had no significant impact. It failed to consolidate below the 1.1091 level, and the upward trend remained intact. Since September 13, the pair has generally been trading within a horizontal channel between the 1.1091 and 1.1191 levels.
EUR/USD on 5M Chart
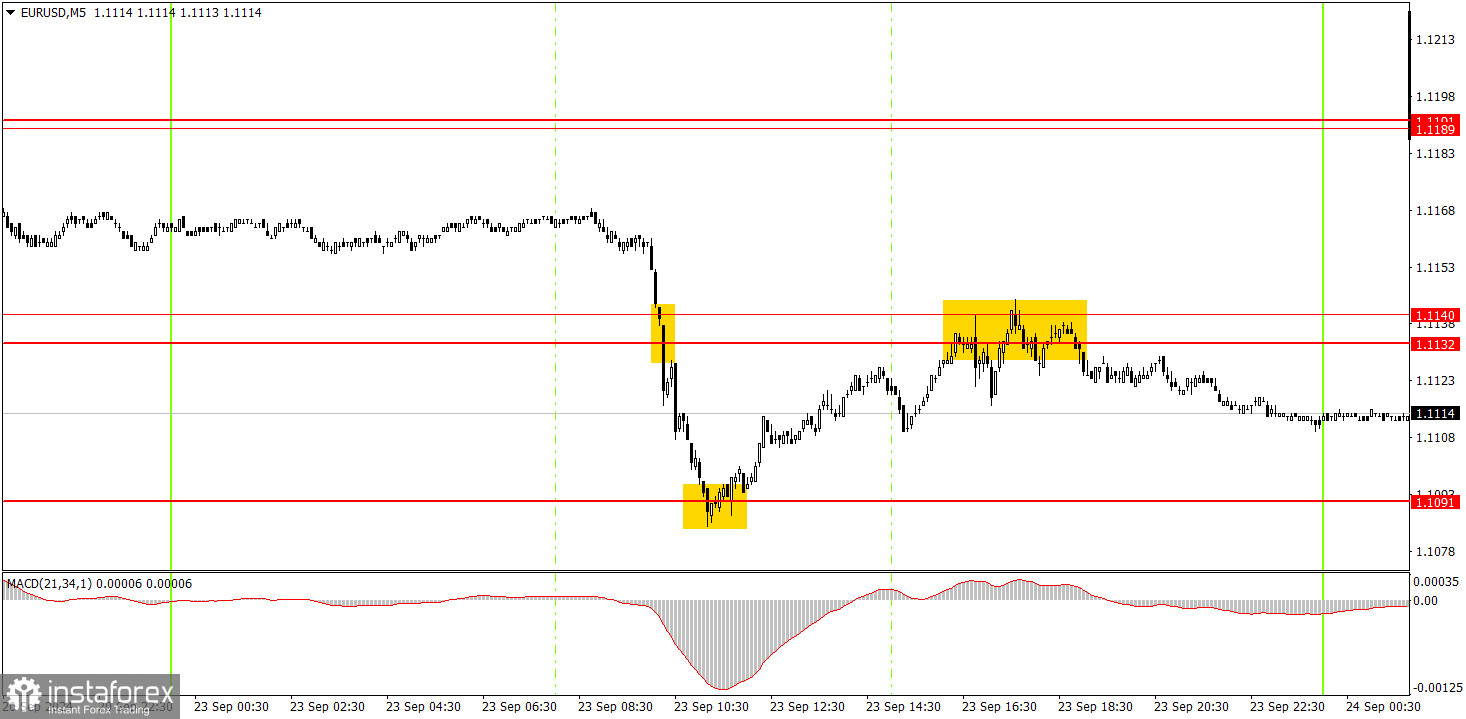
Three trading signals were formed in the 5-minute time frame on Monday. First, the pair consolidated below the 1.1132-1.1140 range and reached the 1.1091 level. Then, it bounced off the 1.1091 level and recovered to the 1.1132-1.1140 range. These were decent signals that could have been acted upon, and each could have yielded around 20 pips of profit. The third signal—a bounce from the 1.1132-1.1140 range—was formed too late, so it could be traded at one's discretion. About ten pips of profit could have also been earned on this signal.
How to Trade on Tuesday:
In the hourly time frame, the pair still has a chance to form a downward trend, but those chances are fading before our eyes. Unfortunately, the irrational selling of the dollar may continue in the medium term since no one knows how long the market will continue to react to the Federal Reserve's monetary policy easing while ignoring the European Central Bank's easing measures. The market continues to factor in almost all future Fed rate cuts into the dollar's price, paying no attention to factors supporting the US currency.
On Tuesday, we can't expect anything but a downward correction. The euro remains overbought and unjustifiably expensive. However, we should consider the horizontal channel that has formed since September 13.
The key levels to consider on the 5M time frame are 1.0726-1.0733, 1.0797-1.0804, 1.0838-1.0856, 1.0888-1.0896, 1.0940, 1.0971, 1.1011, 1.1048, 1.1091, 1.1132-1.1140, 1.1189-1.1191, and 1.1275-1.1292. No significant events are scheduled in the Eurozone or the US on Tuesday. Volatility may be low, and the movement may have no clear direction.
Basic Rules of the Trading System:
1) The strength of a signal is determined by the time it takes for the signal to form (bounce or level breakthrough). The less time it took, the stronger the signal.
2) If two or more trades were opened around any level due to false signals, subsequent signals from that level should be ignored.
3) In a flat market, any currency pair can form multiple false signals or none at all. In any case, it's better to stop trading at the first signs of a flat market.
4) Trades should be opened between the start of the European session and midway through the U.S. session. After this period, all trades must be closed manually.
5) In the hourly time frame, trades based on MACD signals are only advisable amidst good volatility and a trend confirmed by a trendline or trend channel.
6) If two levels are too close to each other (5 to 20 pips), they should be considered a support or resistance area.
7) After moving 15 pips in the intended direction, the Stop Loss should be set to break even.
What's on the Charts:
Support and Resistance price levels: targets for opening long or short positions. You can place Take Profit levels around them.
Red lines: channels or trend lines that depict the current trend and indicate the preferred trading direction.
The MACD indicator (14,22,3): encompassing both the histogram and signal line, acts as an auxiliary tool and can also be used as a source of signals.
Important speeches and reports (always noted in the news calendar) can profoundly influence the movement of a currency pair. Hence, trading during their release calls for heightened caution. It may be reasonable to exit the market to avoid sharp price reversals against the prevailing movement.
For beginners, it's important to remember that not every trade will yield profit. Developing a clear strategy and effective money management is key to success in trading over the long term.