Analyzing Thursday's trades:
GBP/USD on 1H chart

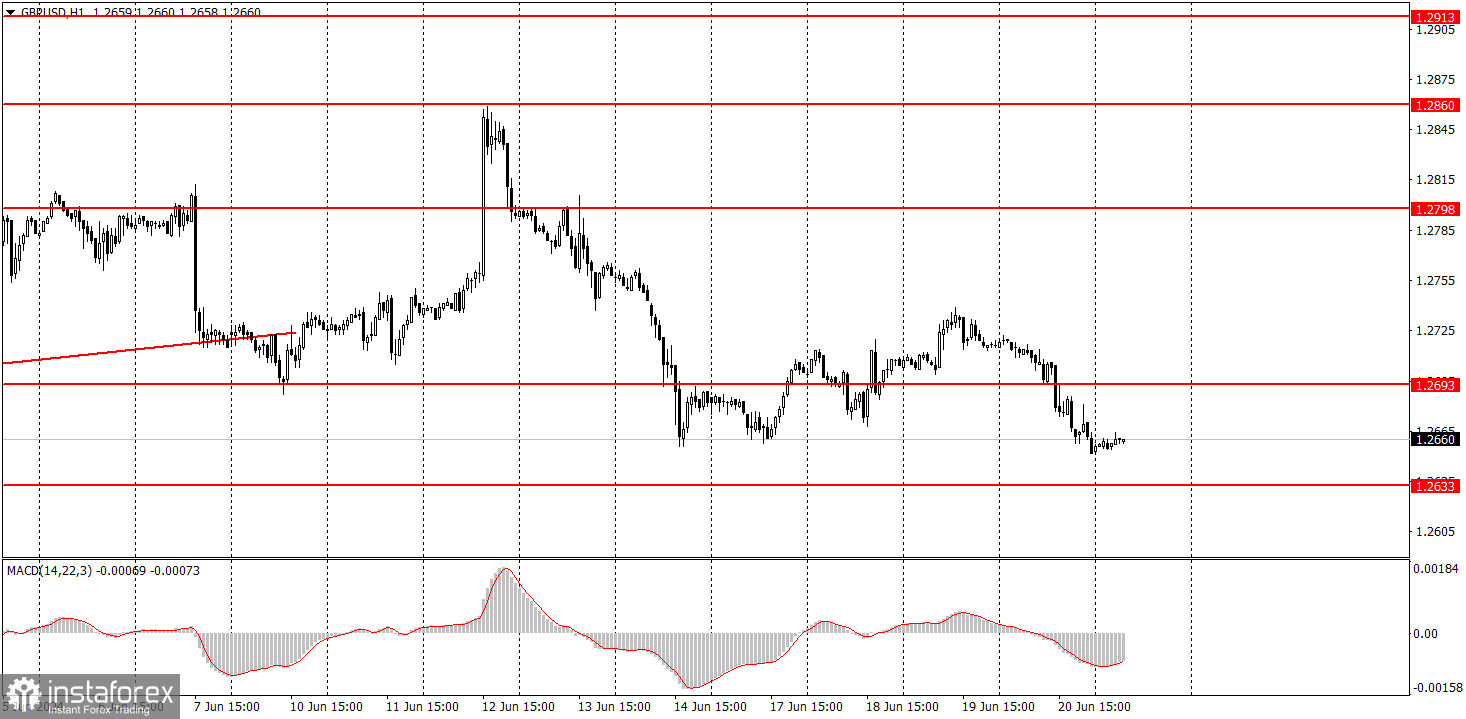
The GBP/USD pair showed a downward movement on Thursday. For beginners, it's worth noting that the pair has been moving more sideways than up or down for several weeks now. It spent a long time between the levels 1.2693 and 1.2860. Last week, it managed to break out of this range and... the pattern did not change. It is difficult to say that the pound's fall on Thursday was a logical move from the currency. The Bank of England left the key rate unchanged and did not signal any readiness to start easing monetary policy at the next meeting (although it is implied), and the number of Monetary Policy Committee members voting in favor of a rate cut remained at 2, as it was a month and a half ago. Therefore, the pound had a few reasons to fall on Thursday. However, days earlier, the pound was rising when there were many reasons for it to drop. GBP/USD continues to exhibit illogical and confusing movements. There has been a downward slope in its movement over the past week and a half, but we strongly doubt that the pair will move to form a downward trend, considering the market's reluctance to sell.
GBP/USD on 5M chart
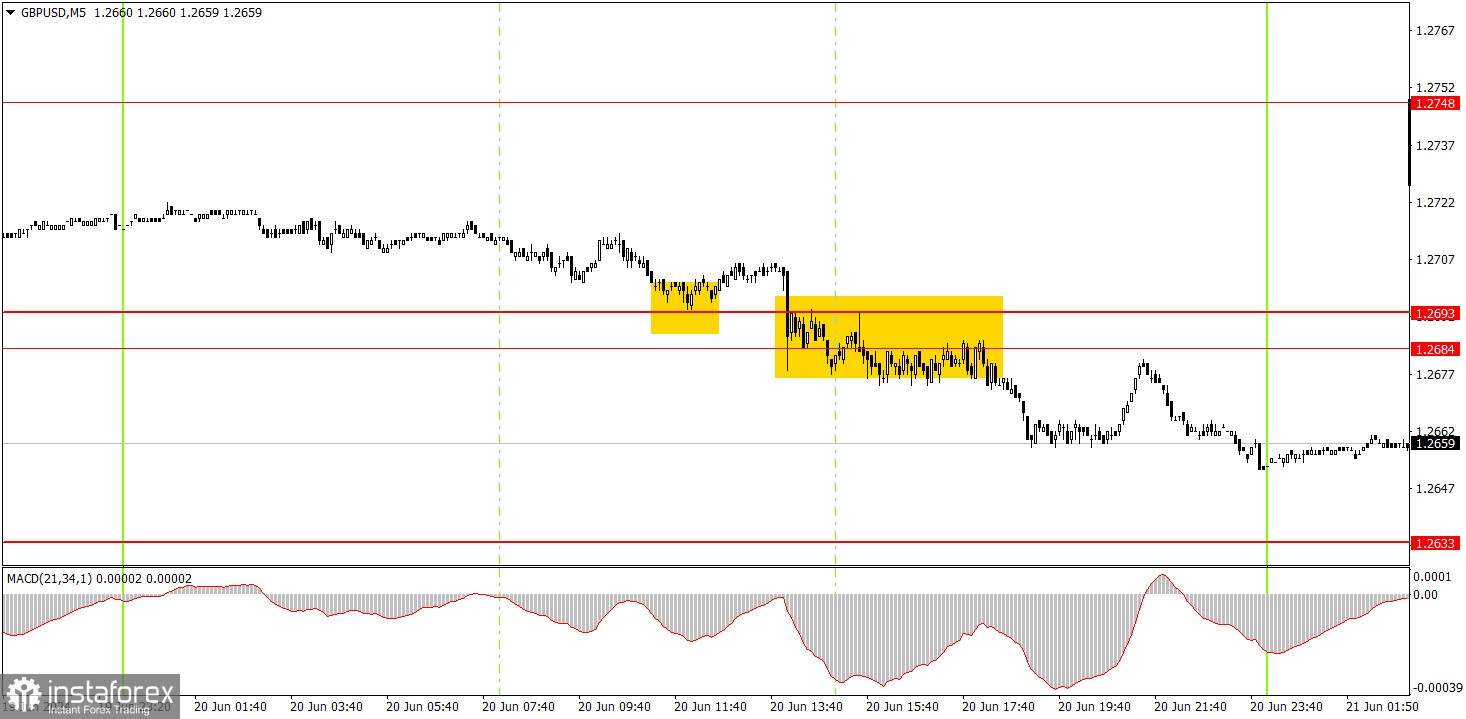
Two trading signals were formed on the 5-minute timeframe, but the pair's volatility left much to be desired, even despite such an important event as the BoE meeting. About an hour before the results, the pair bounced off the 1.2693 level, but it was risky to act on this signal, as no one knew for sure how the market would react to the BoE's decisions. Later, the pair consolidated below the 1.2684-1.2693 area, so traders could open short positions. By the end of the day, the pair had fallen by about 30 pips. It is possible to leave short positions open on Friday in anticipation of further decline.
Trading tips on Friday:
On the hourly chart, the GBP/USD pair continues to show promising signs of forming a downtrend, although the uptrend has not been invalidated, especially considering the prolonged period of sideways movement. Last Friday, the pair's ability to break above the 1.2693 level was a positive development for its bearish potential, a feat repeated this week. However, the market still frequently resists downward moves, even in the presence of technical, fundamental, and macroeconomic factors favoring such a direction.
On Friday, we would advise novice traders to monitor the 1.2684-1.2693 area. Given the recent second breakthrough of this range, short positions are currently more favorable. Nonetheless, one should remain prepared for a potential new uptrend in the British currency that could happen at any time.
The key levels on the 5M chart are 1.2457, 1.2502, 1.2541-1.2547, 1.2605-1.2633, 1.2684-1.2693, 1.2748, 1.2791-1.2798, 1.2848-1.2860, 1.2913, 1.2980. Today, the UK and the US will publish business activity indices for the manufacturing and services sectors for May. These reports could prompt some market reaction, but it's unlikely to be significant.
Basic trading rules:
1) Signal strength is determined by the time taken for its formation (either a bounce or level breach). A shorter formation time indicates a stronger signal.
2) If two or more trades around a certain level are initiated based on false signals, subsequent signals from that level should be disregarded.
3) In a flat market, any currency pair can produce multiple false signals or none at all. In any case, the flat trend is not the best condition for trading.
4) Trading activities are confined between the onset of the European session and mid-way through the U.S. session, after which all open trades should be manually closed.
5) On the 30-minute timeframe, trades based on MACD signals are only advisable amidst substantial volatility and an established trend, confirmed either by a trendline or trend channel.
6) If two levels lie closely together (ranging from 5 to 15 pips apart), they should be considered as a support or resistance zone.
How to read charts:
Support and Resistance price levels can serve as targets when buying or selling. You can place Take Profit levels near them.
Red lines represent channels or trend lines, depicting the current market trend and indicating the preferable trading direction.
The MACD(14,22,3) indicator, encompassing both the histogram and signal line, acts as an auxiliary tool and can also be used as a signal source.
Significant speeches and reports (always noted in the news calendar) can profoundly influence the price dynamics. Hence, trading during their release calls for heightened caution. It may be reasonable to exit the market to prevent abrupt price reversals against the prevailing trend.
Beginners should always remember that not every trade will yield profit. Establishing a clear strategy coupled with sound money management is the cornerstone of sustained trading success.