empty
19.09.2023 10:44 AM
EUR/USD and GBP/USD: Trading plan for beginner traders on September 19, 2023

Details of the Economic Calendar on September 18

Monday, as usual, was accompanied by an empty macroeconomic calendar. Important statistical data were not released in the European Union, the United Kingdom, and the United States.

Analysis of Trading Charts from September 18

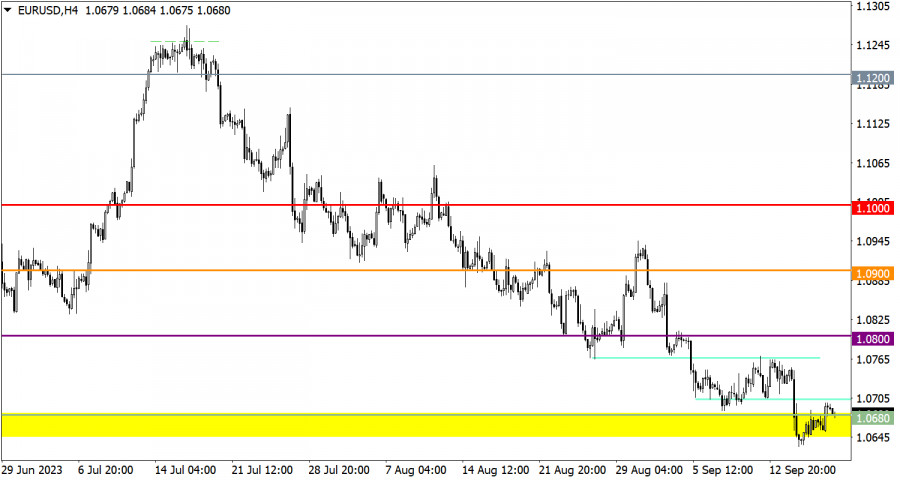
The EUR/USD currency pair slightly strengthened during the price pullback, but no radical changes occurred.

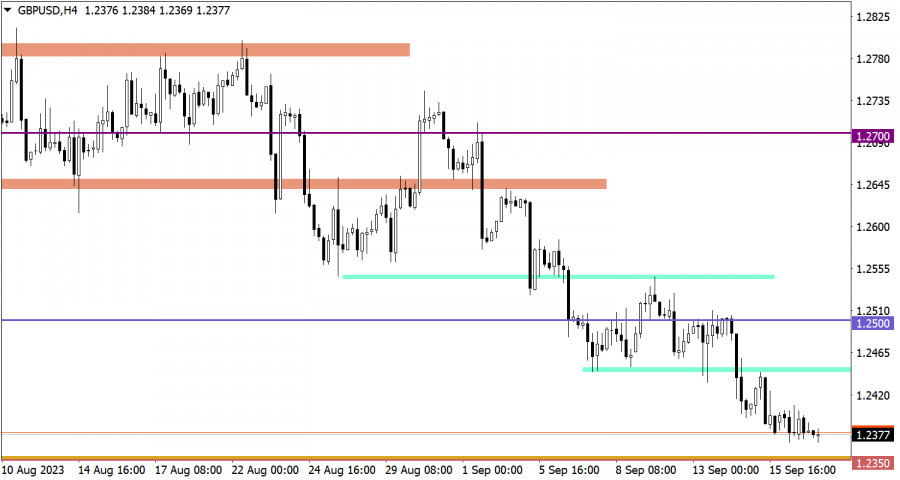
The GBP/USD pair formed a stagnation zone near the base of the downward trend. This price move indicated traders' prevailing interest in short positions, despite the clear oversold signal for the pound sterling.

This image is no longer relevant

Economic Calendar for September 19

Today, data on inflation in the EU is expected to be published. However, since these are final figures, market reaction is unlikely unless they deviate significantly from the preliminary estimate.

EUR/USD Trading Plan for September 19

To initiate the primary stage of the euro's recovery, it is necessary to first ensure that the price remains above the level of 1.0700. In that case, there is a potential for strengthening long-term positions with a target of reaching the level of 1.0750.

Regarding a more negative scenario, for the continuation of the current decline, it is sufficient for the price to remain below the level of 1.0650, which would increase the chances for sellers of further decline.

This image is no longer relevant

GBP/USD Trading Plan for September 19

The current period of stagnation may serve as a temporary pause for regrouping forces in the market, and speculative price movements may occur after its completion. In case of further decline, sellers should pay attention to the support level in the range of 1.2300/1.2350, within which a reduction in short positions may occur. This could lead to a partial recovery of the pound's exchange rate.

However, a technical signal for the continuation of the downward cycle, along with signs of changes in medium-term interests, may emerge if the price remains below the level of 1.2300 during the daily period.

This image is no longer relevant

What's on the charts

The candlestick chart type is white and black graphic rectangles with lines above and below. With a detailed analysis of each individual candle, you can see its characteristics relative to a particular time frame: opening price, closing price, intraday high and low.

Horizontal levels are price coordinates, relative to which a price may stop or reverse its trajectory. In the market, these levels are called support and resistance.

Circles and rectangles are highlighted examples where the price reversed in history. This color highlighting indicates horizontal lines that may put pressure on the asset's price in the future.

The up/down arrows are landmarks of the possible price direction in the future.

Gven Podolsky,
Especialista em análise na InstaForex
© 2007-2025
Selecionar intervalo de tempo
5
min
15
min
30
min
1
hora
4
horas
1
dia
1
s.
Ganhe com as variações das taxas das criptomoedas com a InstaForex.
Baixe o MetaTrader 4 e abra a sua primeira operação.
  • Grand Choice
    Contest by
    InstaForex
    InstaForex always strives to help you
    fulfill your biggest dreams.
    PARTICIPE DO CONCURSO

Recommended Stories

GBP/USD: Plano de Negociação para a Sessão dos E.U.A. de 15 de janeiro (Análise da Negociação da Manhã)

Em minha previsão da manhã, destaquei o nível 1,2194 como um ponto-chave de decisão para a entrada no mercado. Vamos revisar o gráfico de 5 minutos e analisar

Miroslaw Bawulski 16:43 2025-01-15 UTC+2

EUR/USD: Plano de Negociação para a Sessão dos E.U.A. de 15 de janeiro (Análise da Negociação da Manhã)

Em minha previsão da manhã, destaquei o nível de 1,0324 como um ponto de decisão crítico para a entrada no mercado. Vamos dar uma olhada no gráfico de 5 minutos

Miroslaw Bawulski 16:22 2025-01-15 UTC+2

EUR/USD: Plano de Negociação para a Sessão dos E.U.A. de 14 de janeiro (Revisão das Negociações da Manhã)

Na minha previsão da manhã, foquei no nível 1,0277 e planejei tomar decisões de negociação com base nele. Vamos dar uma olhada no gráfico de 5 minutos para

Miroslaw Bawulski 19:31 2025-01-14 UTC+2

Como negociar o par EUR/USD em 14 de janeiro? Dicas simples e análise de negociação para iniciantes

Análise das operações de segunda-feira Gráfico 1H do EUR/USD Na segunda-feira, o par de moedas EUR/USD começou a mostrar sinais de uma correção para cima. No entanto, o dia começou

Paolo Greco 16:16 2025-01-14 UTC+2

GBP/USD: Plano de negociação para a sessão dos E.U.A. de 9 de janeiro (análise das negociações da manhã)

Na minha previsão da manhã, destaquei o nível 1,2265 e fiz planos para tomar decisões de negociação com base nele. Vamos examinar o gráfico de 5 minutos para analisar

Miroslaw Bawulski 20:19 2025-01-09 UTC+2

Recomendações de negociação e análise do EUR/USD em 9 de janeiro: Outra surpresa para o dólar

Na quarta-feira, o par EUR/USD registrou outra queda significativa. Embora a queda não tenha sido tão acentuada quanto a do GBP/USD, o euro segue em baixa pelo segundo dia consecutivo

Paolo Greco 14:53 2025-01-09 UTC+2

EUR/USD: Plano de negociação para a sessão dos E.U.A. de 8 de janeiro (análise das negociações da manhã)

Na minha previsão da manhã, foquei no nível 1,0341 e planejei tomar decisões de negociação com base nele. Vamos dar uma olhada no gráfico de 5 minutos e analisar

Miroslaw Bawulski 20:31 2025-01-08 UTC+2

GBP/USD: Plano de negociação para a sessão dos E.U. de 20 de dezembro (revisão das negociações da manhã). A libra se recuperou ligeiramente

Em minha previsão matinal, destaquei o nível 1,2526 como um ponto-chave para entrar no mercado. Observando o gráfico de 5 minutos, a libra subiu, mas não testou 1,2526

Miroslaw Bawulski 15:22 2024-12-20 UTC+2

Como negociar o par GBP/USD em 19 de dezembro? Dicas simples e análise de negociação para iniciantes

Análise das negociações de quarta-feira Gráfico 1H do GBP/USD Na quarta-feira, o par GBP/USD registrou uma queda acentuada devido ao aumento repentino do sentimento hawkish na Reserva Federal. Conforme mencionado

Paolo Greco 13:52 2024-12-19 UTC+2

EUR/USD: 18 de dezembro - Plano de negociação para a sessão dos E.U. (Análise das negociações da manhã). A inflação da zona do euro continua a cair

Em minha previsão da manhã, destaquei o nível 1,0506 como um ponto-chave de decisão para a entrada no mercado. Vamos dar uma olhada no gráfico de 5 minutos para entender

Miroslaw Bawulski 21:00 2024-12-18 UTC+2
Não pode falar agora?
Faça sua pergunta no chat.
Widget callback
 

Dear visitor,

Your IP address shows that you are currently located in the USA. If you are a resident of the United States, you are prohibited from using the services of InstaFintech Group including online trading, online transfers, deposit/withdrawal of funds, etc.

If you think you are seeing this message by mistake and your location is not the US, kindly proceed to the website. Otherwise, you must leave the website in order to comply with government restrictions.

Why does your IP address show your location as the USA?

  • - you are using a VPN provided by a hosting company based in the United States;
  • - your IP does not have proper WHOIS records;
  • - an error occurred in the WHOIS geolocation database.

Please confirm whether you are a US resident or not by clicking the relevant button below. If you choose the wrong option, being a US resident, you will not be able to open an account with InstaForex anyway.

We are sorry for any inconvenience caused by this message.