Analysis of EUR/USD 5M
EUR/USD finally started to retreat on Thursday. Although, there weren't any significant reports or events behind this movement. But sooner or later, the euro was destined to fall. Take note that in recent months, both the euro and the pound have either rallied in recent months or simply traded too high for the fundamental backdrop that the market had at its disposal. Therefore, we support and welcome any downward movement from such currencies. The only noteworthy economic report on Thursday was the data on the number of jobless claims, which turned out to be slightly below forecasts, and this could have supported the dollar. However, the report was not so resonant as to be solely responsible for the pair's 100-point decline.
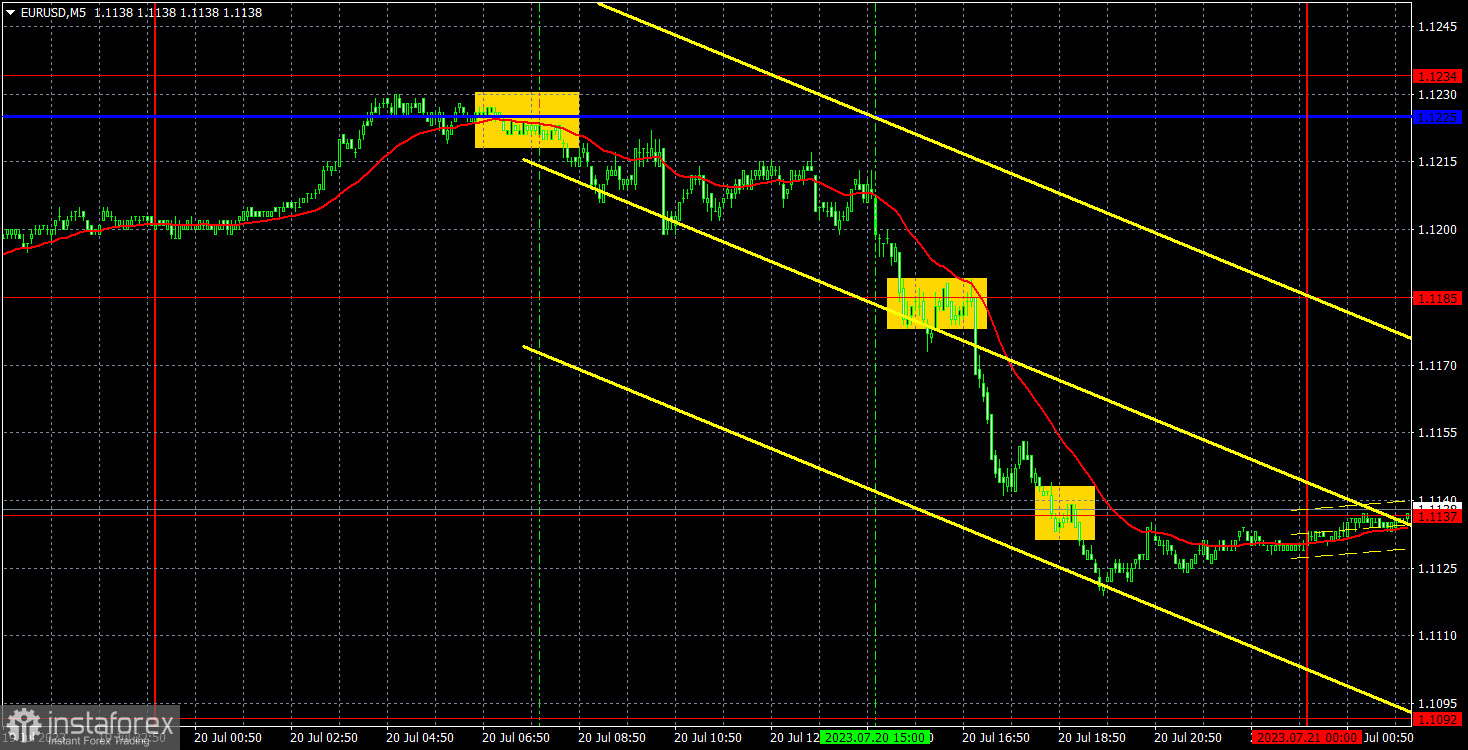
Speaking of trading signals, they were simply excellent on Thursday. First, the pair bounced off the critical line, then broke through the level of 1.1185, and then the level of 1.1137. As a result, traders could open a short position near the critical line and close it below the level of 1.1137. It was possible to make 85 points of profit.
COT report:
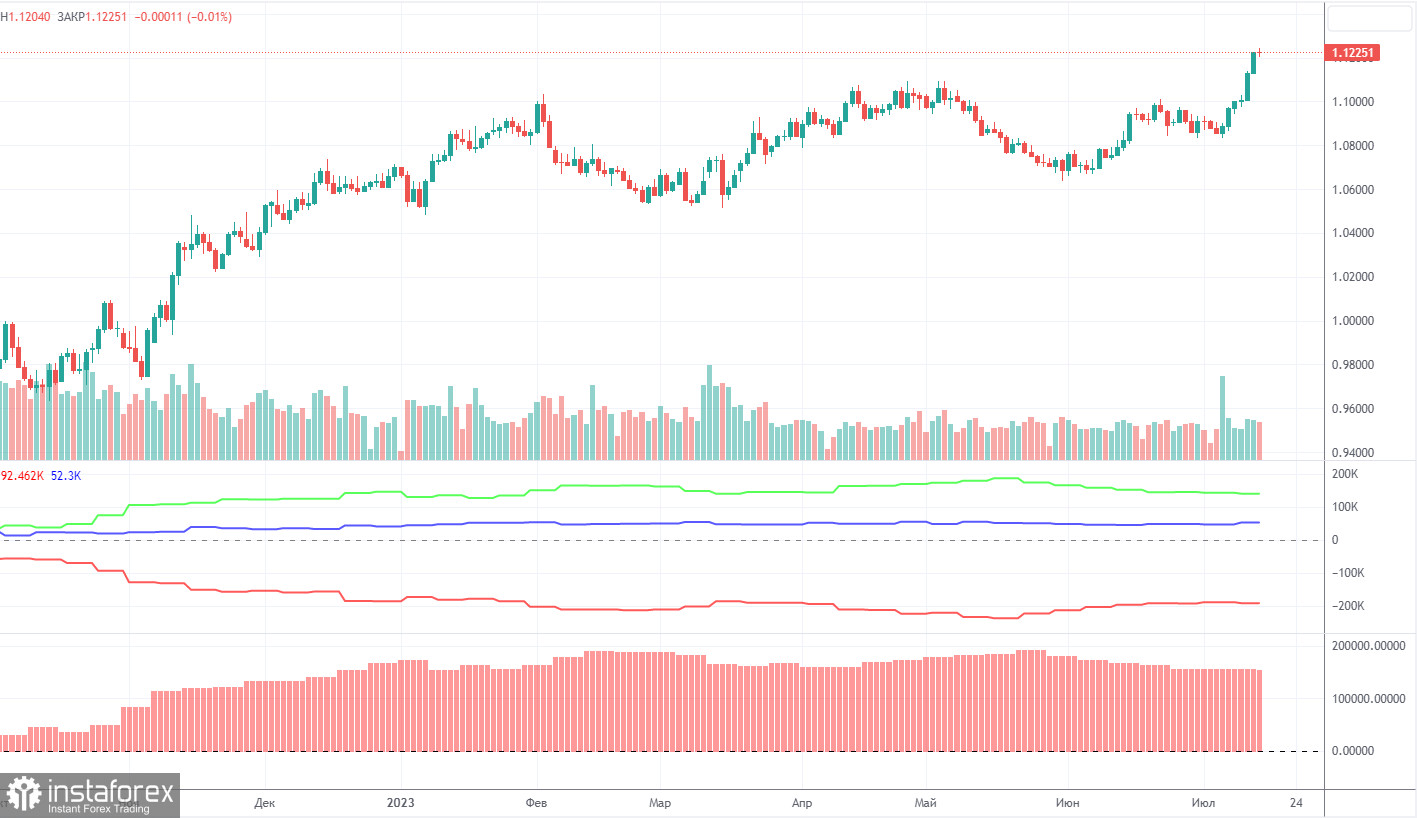
On Friday, a new COT report for July 11 was released. In the last 10 months, COT reports fully corresponded to what is happening in the market. The chart above clearly shows that the net position of major traders (the second indicator) began to grow in September 2022 and at about the same time the euro started climbing too. In the last 5 months, the net position has not risen but the euro remains at very high levels. At the moment, the net position of non-profit traders is bullish. The euro keeps climbing against the US dollar.
I have already mentioned the fact that a fairly high value of the net position signals the end of an uptrend. This is also confirmed by the first indicator where the red and green lines are very far from each other. Usually, it precedes the end of the trend. During the last reporting week, the number of long positions of the non-commercial group of traders increased by 3,000 and the number of short ones- by 5,700. The net position declined by 2,700 positions. The net position is falling, while the euro is growing. This is illogical. The number of long positions is higher than the number of short ones of non-commercial traders by 140,000. This is a very large gap as the difference is almost threefold. Even without COT reports, it is obvious that the euro should decline but speculators are still in no hurry to sell it.
Analysis of EUR/USD 1H
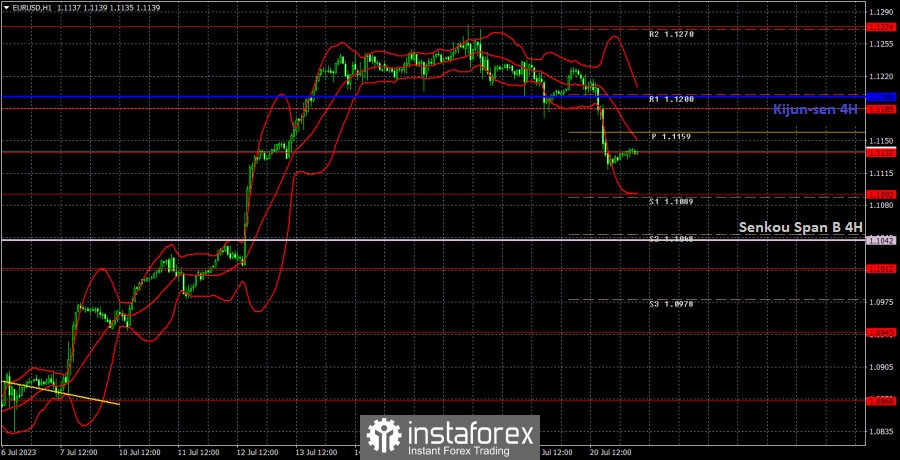
On the 1H chart, the euro/dollar pair finally had room to correct and settled below the critical Kijun-sen line. Thus, the euro may descend to the Senkou Span B line in the coming days. We expect a much stronger decline from it and do not believe that fundamental support for the dollar is necessary for this.
On July 21, traders should pay attention to the following key levels: 1.0806, 1.0868, 1.0943, 1.1012, 1.1092, 1.1137, 1.1185, 1.1274, 1.1321, 1.1391, as well as the Senkou Span B line (1.1042) and the Kijun-sen line (1.1198) lines. The lines of the Ichimoku indicator can move during the day, which should be taken into account when determining trading signals. There are support and resistance levels that can be used to lock in profits. Traders look for signals at rebounds and breakouts. It is recommended to set the Stop Loss orders at the breakeven level when the price moves in the right direction by 15 pips. This will protect against possible losses if the signal turns out to be false.
Today, there are no important events lined up in the EU and the US. However, the euro and the pound have started to trade lower, so it can continue to do so today even without any reports or events. However, volatility may still fall. The US session, as often happens, may be more active than the European one.
Description of the chart:
Support and resistance levels are thick red lines near which the trend may end. They do not provide trading signals;
The Kijun-sen and Senkou Span B lines are the lines of the Ichimoku indicator, plotted to the 1H timeframe from the 4H one. They provide trading signals;
Extreme levels are thin red lines from which the price bounced earlier. They provide trading signals;
Yellow lines are trend lines, trend channels, and any other technical patterns;
Indicator 1 on the COT charts is the net position size for each category of traders;
Indicator 2 on the COT charts is the net position size for the Non-commercial group.