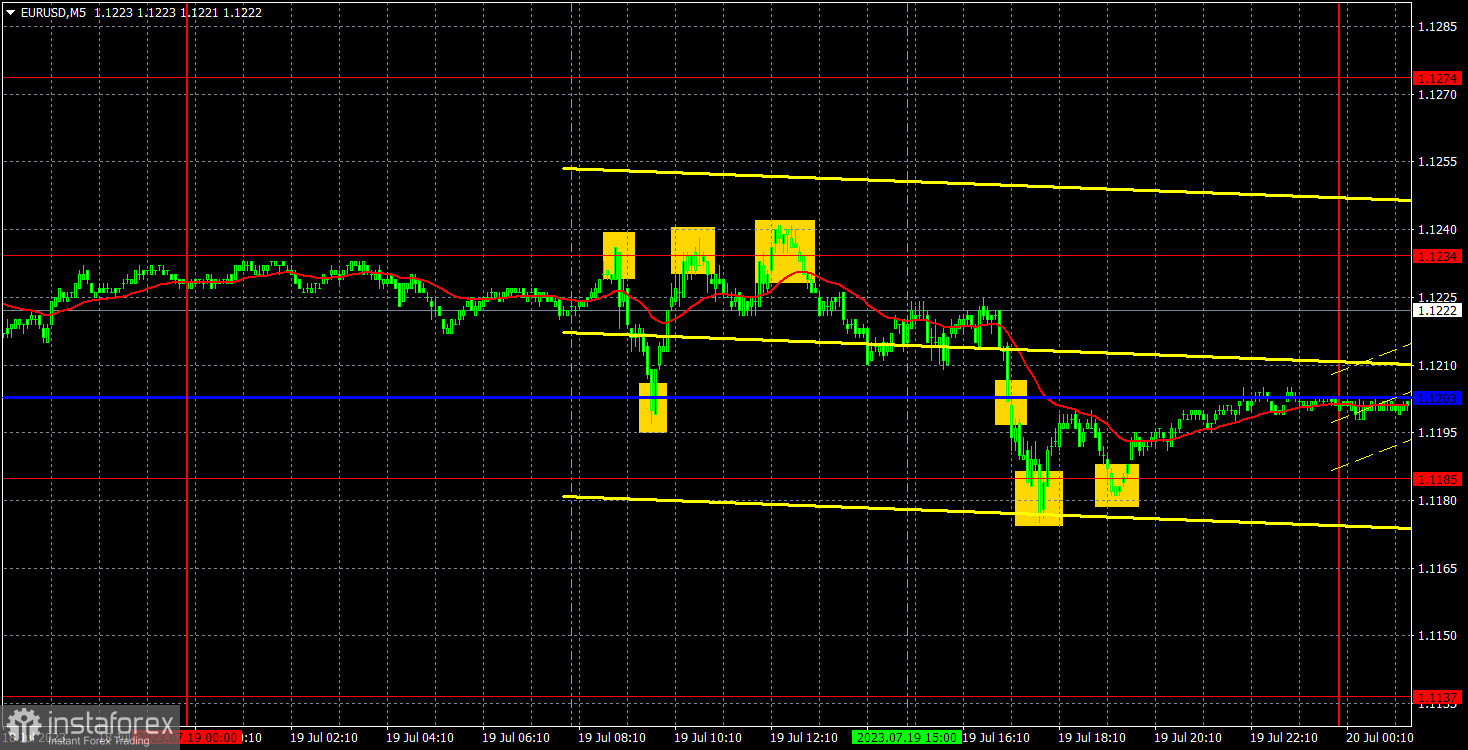
Analysis of EUR/USD 5M.
On Wednesday, the EUR/USD pair moved sideways. Despite the fact that the euro declined at the end of the day, the chart above clearly shows that the sideways movement prevailed and volatility was low again. This was hardly surprising given the macroeconomic events of the past day. Traders ignored all published reports. Nevertheless, the European currency is trading close to its annual highs. The correction that has been going on for the last few days is very weak. In the European Union, the second inflation estimate for June was released. The reading remained the same. Hence, speculators did not react to this report.
Yesterday, there were plenty of trading signals. The levels were very close to each other. This is why there were so many entry points. We are not going to analyze each separate signal, because they are all marked in the chart above. All signals can be considered correct because the price has reached the target levels. It was possible to make a profit of about 50-60 pips but one should have opened lots of positions. In any case, traders managed to earn profit.
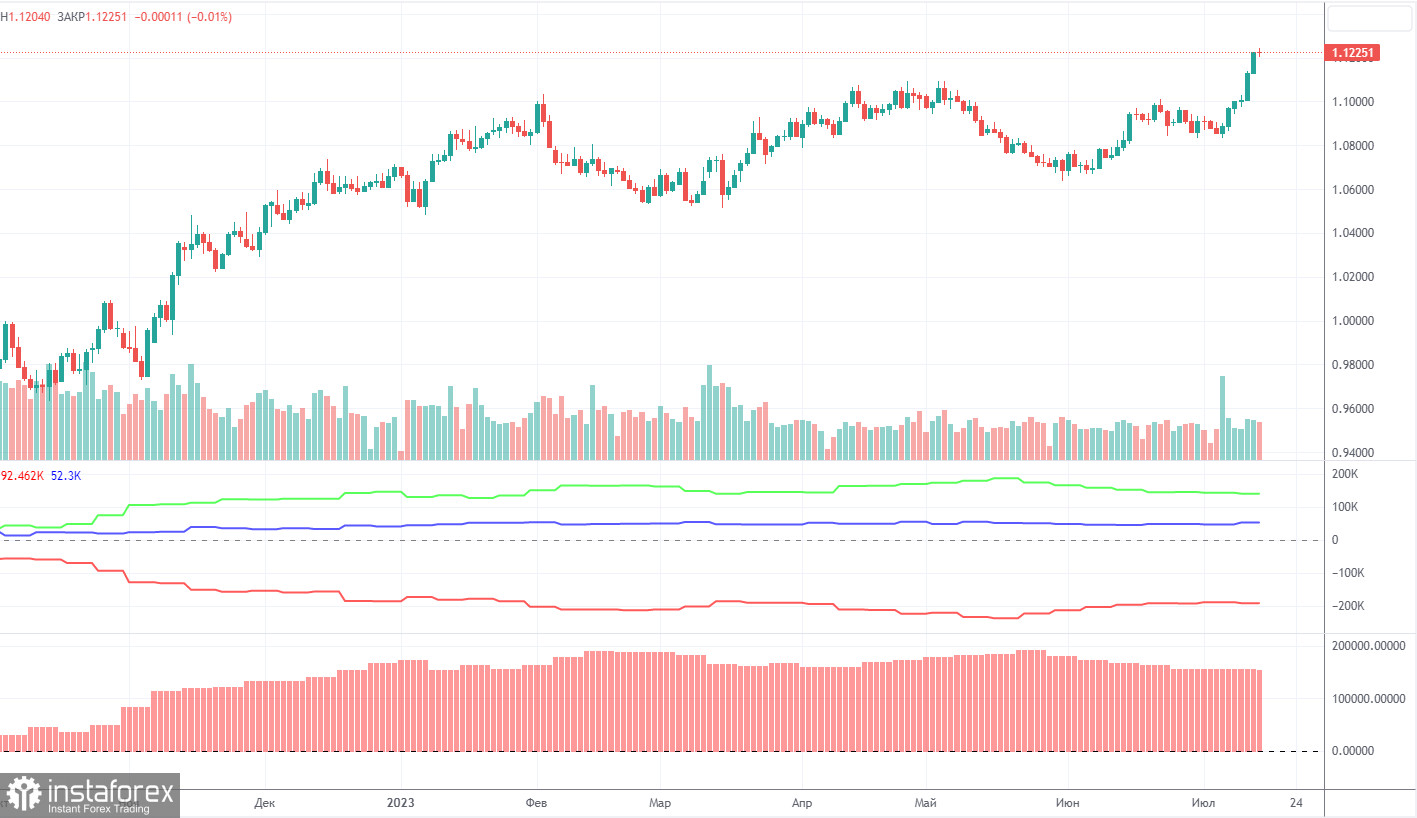
COT report:
On Friday, a new COT report for July 11 was released. In the last 10 months, COT reports fully corresponded to what is happening in the market. The chart above clearly shows that the net position of major traders (the second indicator) began to grow in September 2022 and at about the same time the euro started climbing too. In the last 5 months, the net position has not risen but the euro remains at very high levels. At the moment, the net position of non-profit traders is bullish. The euro keeps climbing against the US dollar.
I have already mentioned the fact that a fairly high value of the net position signals the end of an uptrend. This is also confirmed by the first indicator where the red and green lines are very far from each other. Usually, it precedes the end of the trend. During the last reporting week, the number of long positions of the non-commercial group if traders increased by 3,000 and the number of short ones- by 5,700. The net position declined by 2,700 positions. The net position is falling, while the euro is growing. This is illogical. The number of long positions is higher than the number of short ones of non-commercial traders by 140,000. This is a very large gap as the difference is almost threefold. Even without COT reports, it is obvious that the euro should decline but speculators are still in no hurry to sell it.
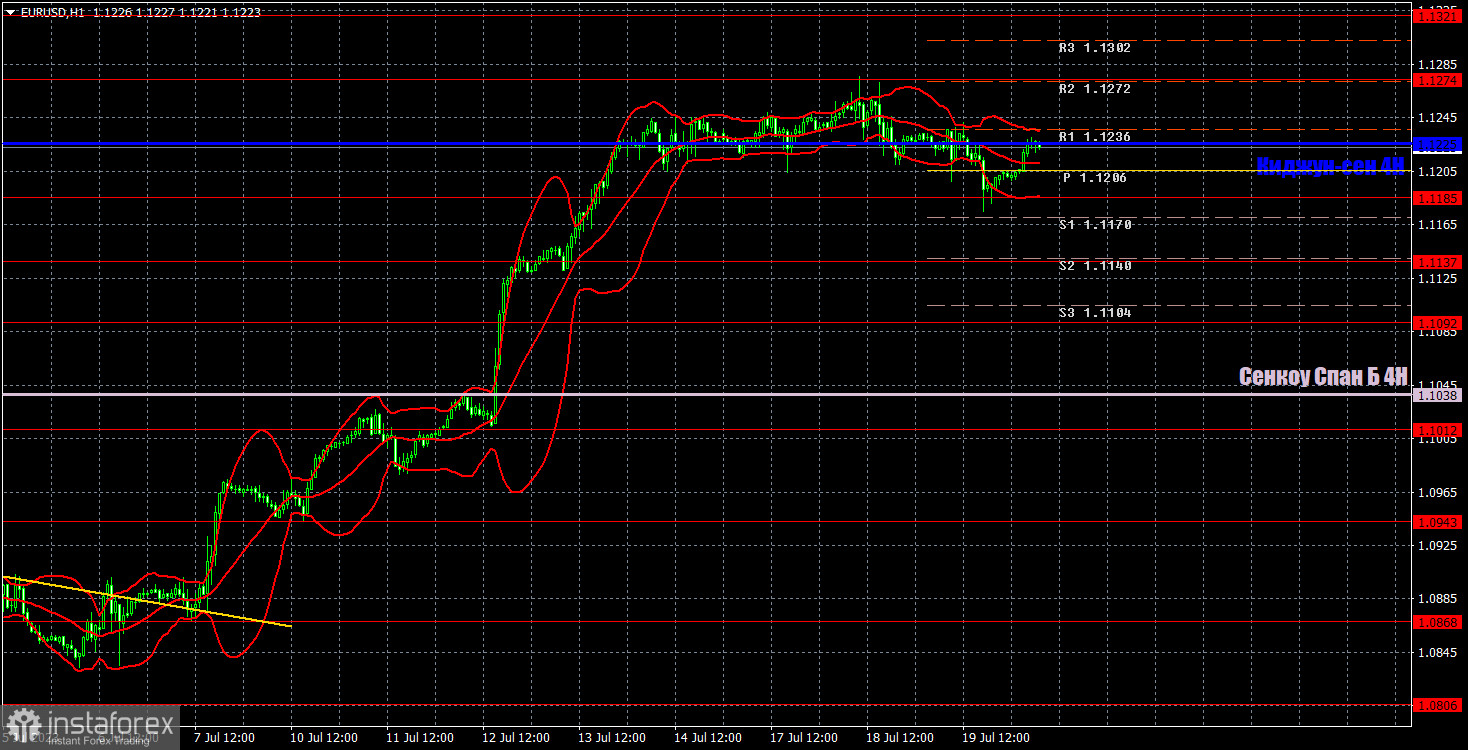
Analysis of EUR/USD 1H.
On the 1H timeframe, the pair continues to grow almost non-stop. I believe that traders have started a new sell-off sales of the US dollar. So, the current economic reports have practically no effect on the market sentiment. It is impossible to build a trend line as the upward movement is too strong. There are no clear support levels. In the last few days, the pair has been moving in a narrow range.
On July 20, one should pay attention to the following levels - 1.0806, 1.0868, 1.0943, 1.1012, 1.1092, 1.1137, 1.1185, 1.1274, 1.1321, 1.1391, as well as the Senkou Span B (1.1038) and Kijun-sen (1.1203) lines. The lines of the Ichimoku indicator can move during the day, which should be taken into account when determining trading signals. There are support and resistance levels that can be used to lock in profits. Traders look for signals at rebounds and breakouts. It is recommended to set the Stop Loss orders at the breakeven level when the price moves in the right direction by 15 pips. This will protect against possible losses if the signal turns out to be false.
There are no crucial reports in the European Union today. The United States will only reveal the initial jobless claims report. This week, the economic calendar is rather uneventful. This is why volatility will hardly rise today.
Description of the chart:
Support and resistance levels are thick red lines near which the trend may end. They do not provide trading signals;
The Kijun-sen and Senkou Span B lines are the lines of the Ichimoku indicator, plotted to the 1H timeframe from the 4H one. They provide trading signals;
Extreme levels are thin red lines from which the price bounced earlier. They provide trading signals;
Yellow lines are trend lines, trend channels, and any other technical patterns;
Indicator 1 on the COT charts is the net position size for each category of traders;
Indicator 2 on the COT charts is the net position size for the Non-commercial group.