Details of the economic calendar on July 5
Final data on business activity indices in the European Union and the United Kingdom were published yesterday, slightly deviating from expectations. The EU services business activity index dropped from 55.1 to 52.0 points, whereas the preliminary estimate suggested a drop to 52.4. Composite PMI, on the other hand, fell from 52.8 to 49.9 points instead of the forecasted 50.3. This is another confirmation of the gradual slide of the European economy into recession. However, this did not lead to a significant decline in the euro, which remained largely stable. The market was already prepared for such a development.
In the UK, the final business activity index data completely matched the preliminary estimates and did not have a significant impact. The services PMI dropped from 55.2 to 53.7 points, and the composite PMI fell from 54.0 to 52.8.
Special attention should be given to the producer price index in the eurozone. The pace of price decline was expected to slow down from -3.2% to -1.6% MoM, but it only slowed down to -1.9% MoM. Nevertheless, this indicates a slowdown in the pace of producer price decline, which means some reduction in the potential for overall inflation reduction. Therefore, the European Central Bank may continue to raise interest rates as it has practically no other choice. These results are likely to gradually support the growth of the euro, albeit not significantly. This, in turn, may have an impact on the British pound.
Analysis of trading charts from July 5
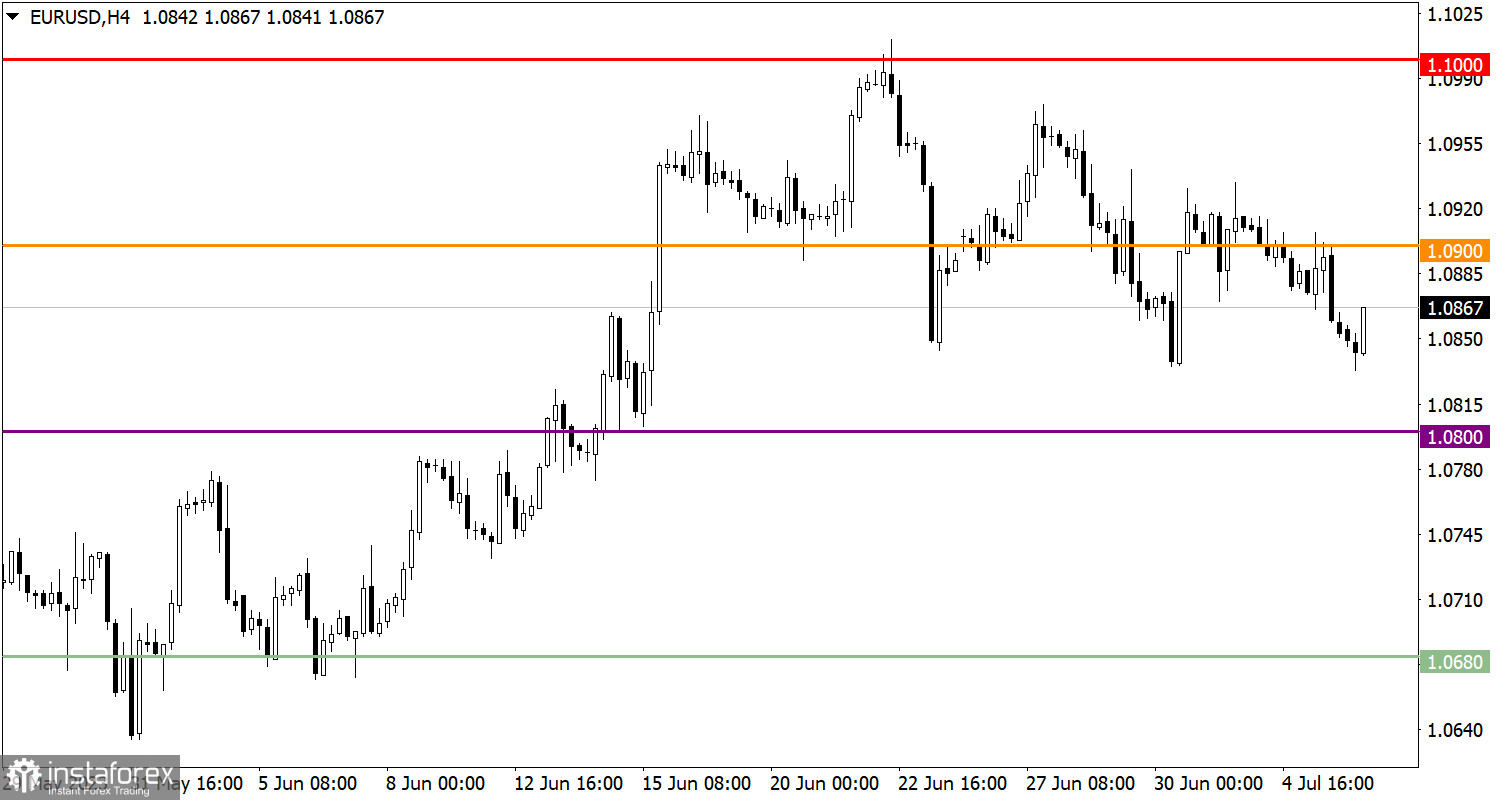
The EUR/USD currency pair prolonged its corrective trend on the market as it descended from the 1.1000 resistance level.
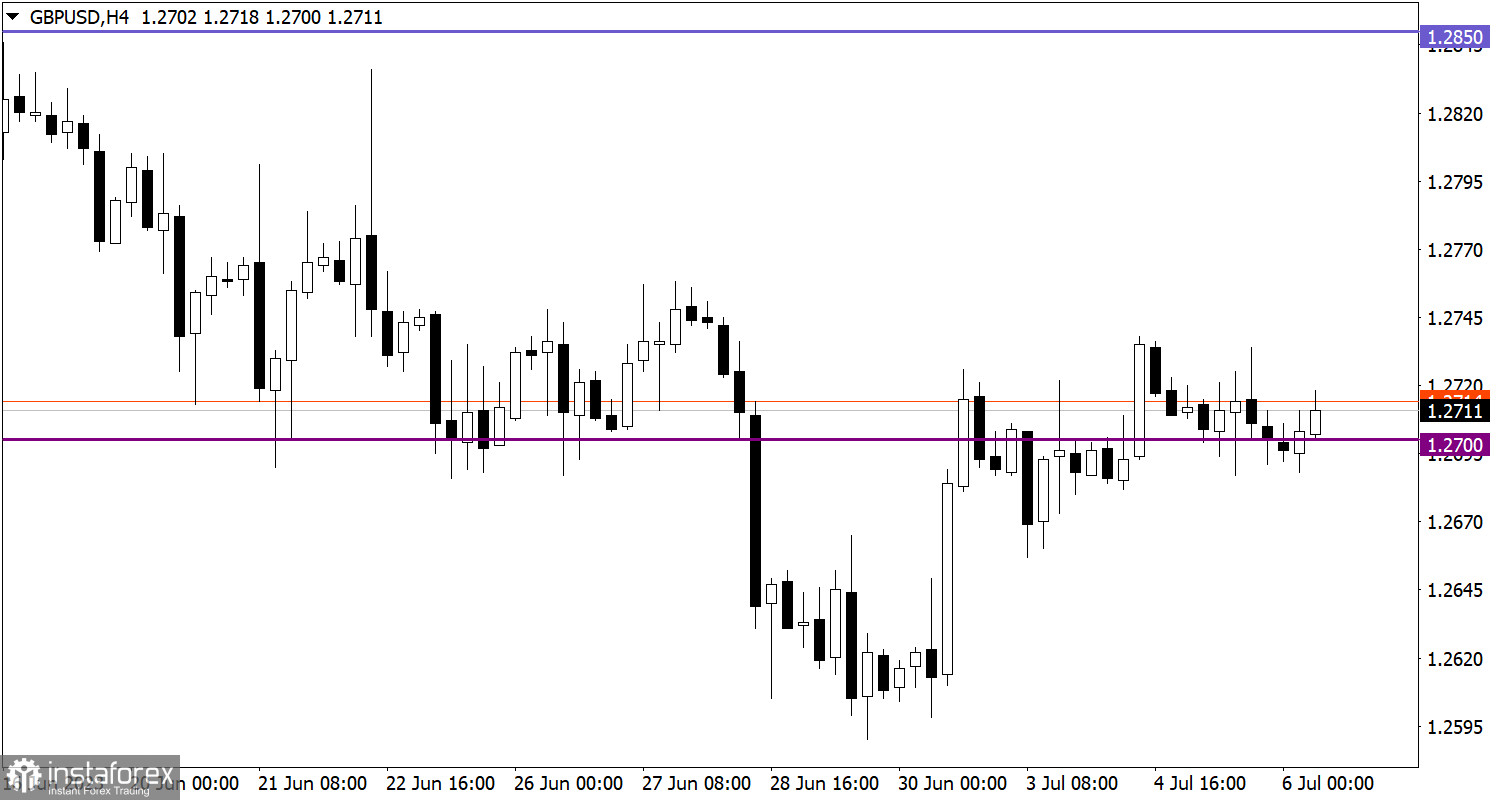
The GBP/USD pair has remained stable around the 1.2700 level for almost a week, showing low activity. The price fluctuation range is approximately 50 points, which may indicate an accumulation of trading forces.
Economic Calendar for July 6
Today, retail sales data for the EU is expected to be published, where the rate of decline could accelerate from -2.6% to -3.2%.
During the U.S. trading session, a large package of statistical data from the United States is expected to be released. The first thing to pay attention to is the change in the number of employed in the non-farm sector from ADP, where an increase of 230,000 is expected. These are quite strong labor market indicators for the U.S.
Subsequently, data on U.S. jobless claims is expected, where the figures may rise, which is a negative factor for the labor market. The business activity index in the services sector, which may decline from 54.9 to 54.1, will conclude the lineup.
EUR/USD trading plan for July 6
In this situation, a stable hold of the price below the level of 1.0840 could lead to a subsequent downward movement, reaching at least the level of 1.0800. However, considering the previous experience around 1.0840/1.0850, this zone could put pressure on sellers. In this case, a price rebound similar to last week may be possible.
GBP/USD trading plan for July 6
In this situation, to continue the growth of long position volumes, the quote needs to be held above the 1.2750 level. If this condition is met, a gradual recovery of the British pound's value after the recent corrective movement is possible.
However, if the price returns below the value of 1.0650, this may lead to the activation of short positions and the update of the local low of the corrective cycle.
It is important to note that market conditions may change, so you should monitor current price movements and pay attention to additional signals. This will help to make informed decisions based on up-to-date information.
What's on the charts
The candlestick chart type is white and black graphic rectangles with lines above and below. With a detailed analysis of each individual candle, you can see its characteristics relative to a particular time frame: opening price, closing price, intraday high and low.
Horizontal levels are price coordinates, relative to which a price may stop or reverse its trajectory. In the market, these levels are called support and resistance.
Circles and rectangles are highlighted examples where the price reversed in history. This color highlighting indicates horizontal lines that may put pressure on the asset's price in the future.
The up/down arrows are landmarks of the possible price direction in the future.