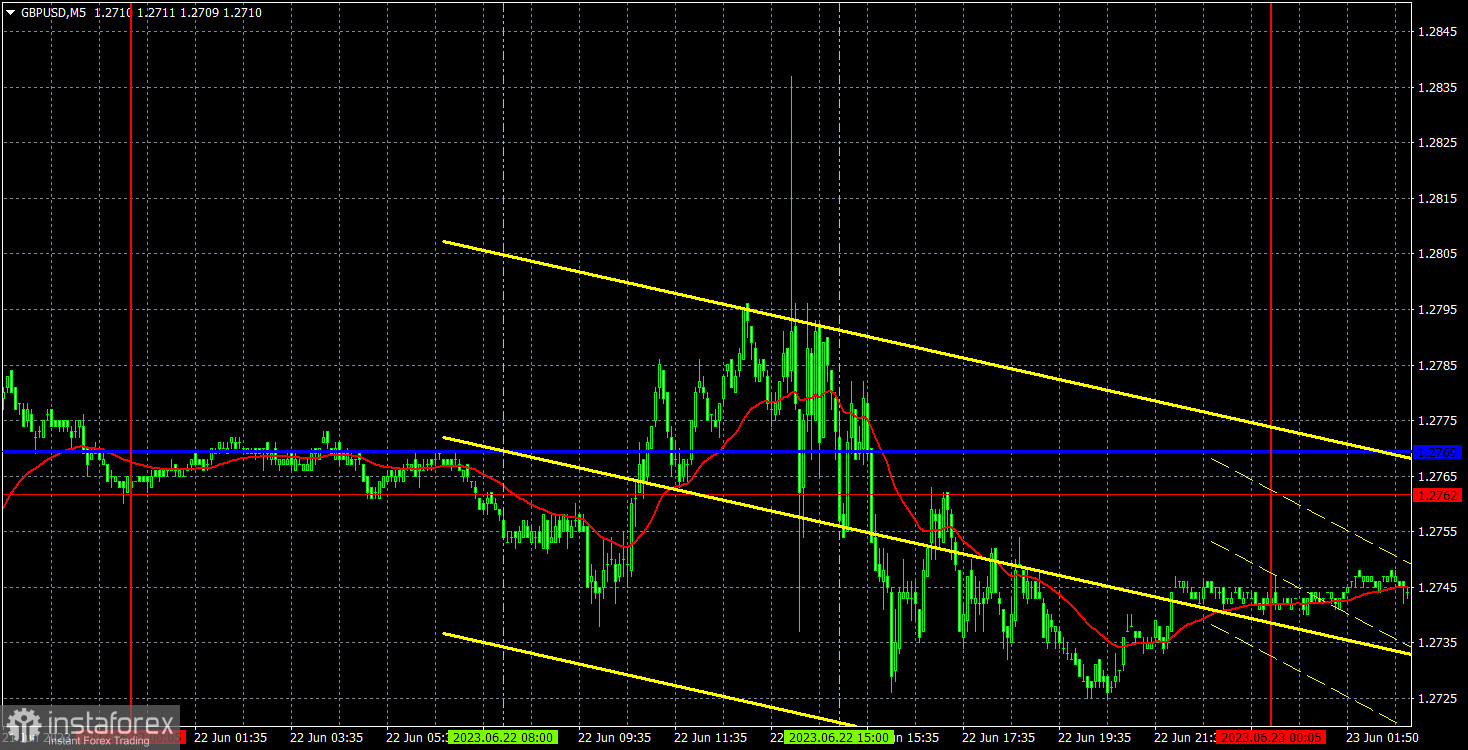
5M chart of GBP/USD
GBP/USD moved in a highly turbulent manner on Thursday. However, this is not surprising after yesterday's Bank of England meeting. For the first time in a long time, the experts' forecasts did not align with the actual decisions. The key rate was unexpectedly raised by 0.5%, and the market was taken aback. Logically, the ever-strengthening pound had a great opportunity to rally, as the BoE made the most hawkish decision. But ironically, yesterday the pound plunged post the BoE 50 bps rate hike. Today, many analysts will say that this decision was expected and the market had already priced it in, which would be completely untrue since there were no grounds to expect the BoE to become even more aggressive before the latest inflation report, which was released on Wednesday. And the pound did not even rise in the last two days.
There is no point in analyzing yesterday's trading signals. Traders may have tried to work with only the first sell signal, which occurred when the price settled below the level of 1.2762. It closed with a stop loss at breakeven. Then all signals were formed within a couple of hours, during or shortly after the BoE meeting. The pair fluctuated back and forth, and in this confusion, it was difficult to determine the relevance of any particular signal. It made no sense to trade sell signals during the US trading session as the pair's growth seemed much more logical.
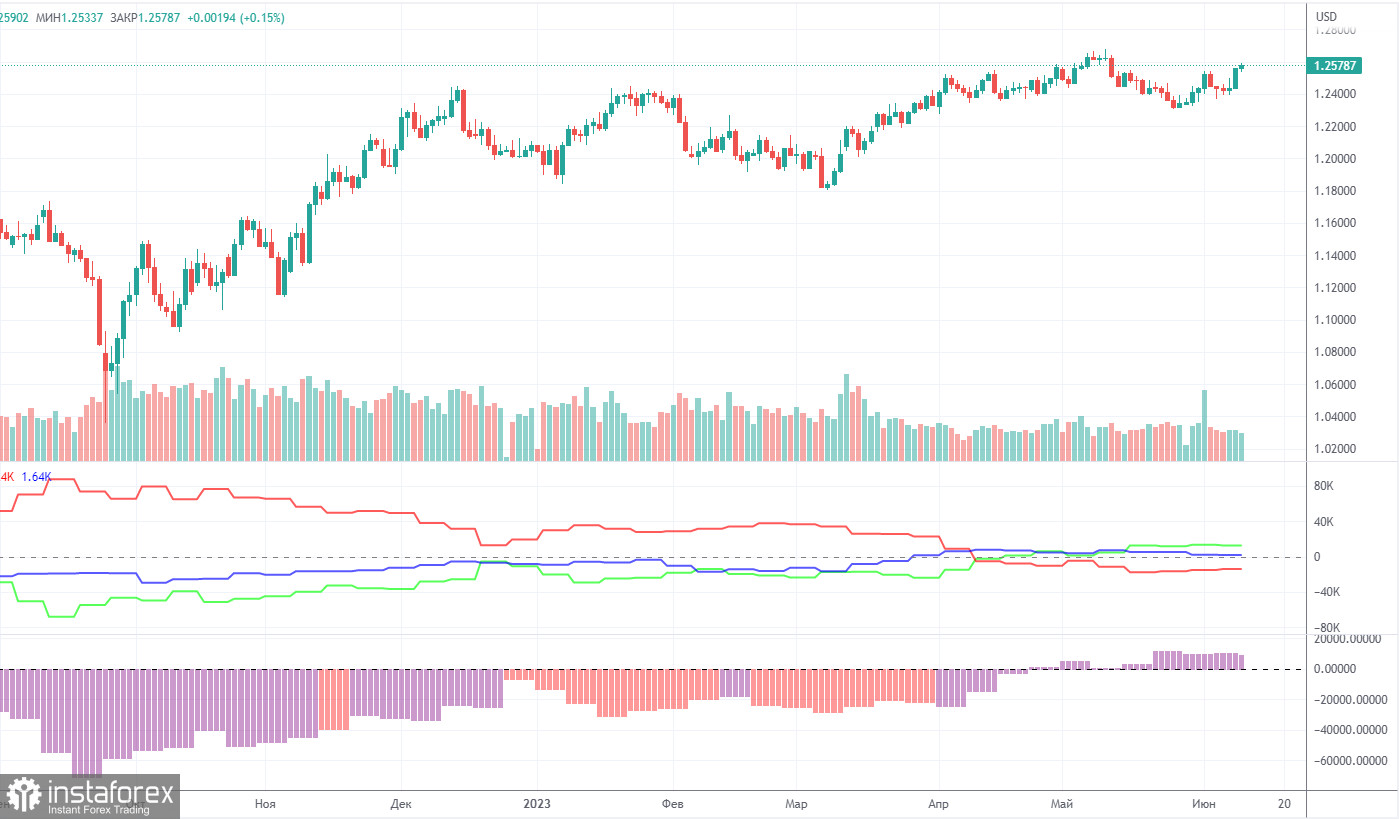
COT report:
According to the latest report, non-commercial traders closed 5,200 long positions and 4,500 short ones. The net position dropped by 700 but remained bullish. Over the past 9-10 months, the net position has been on the rise despite bearish sentiment. In fact, sentiment is now bullish, but it is a pure formality. The pound is bullish against the greenback in the medium term, but there have been hardly any reasons for that. We assume that a prolonged bear run may soon begin even though COT reports suggest a bullish continuation. However, we can hardly explain why the uptrend should go on.
The pound has gained about 2,300 pips. Therefore, a bearish correction is now needed. Otherwise, a bullish continuation would make no sense even despite the lack of support from fundamental factors. Overall, non-commercial traders hold 52,500 sell positions and 65,000 long ones. We do not see the pair extending growth in the long term.
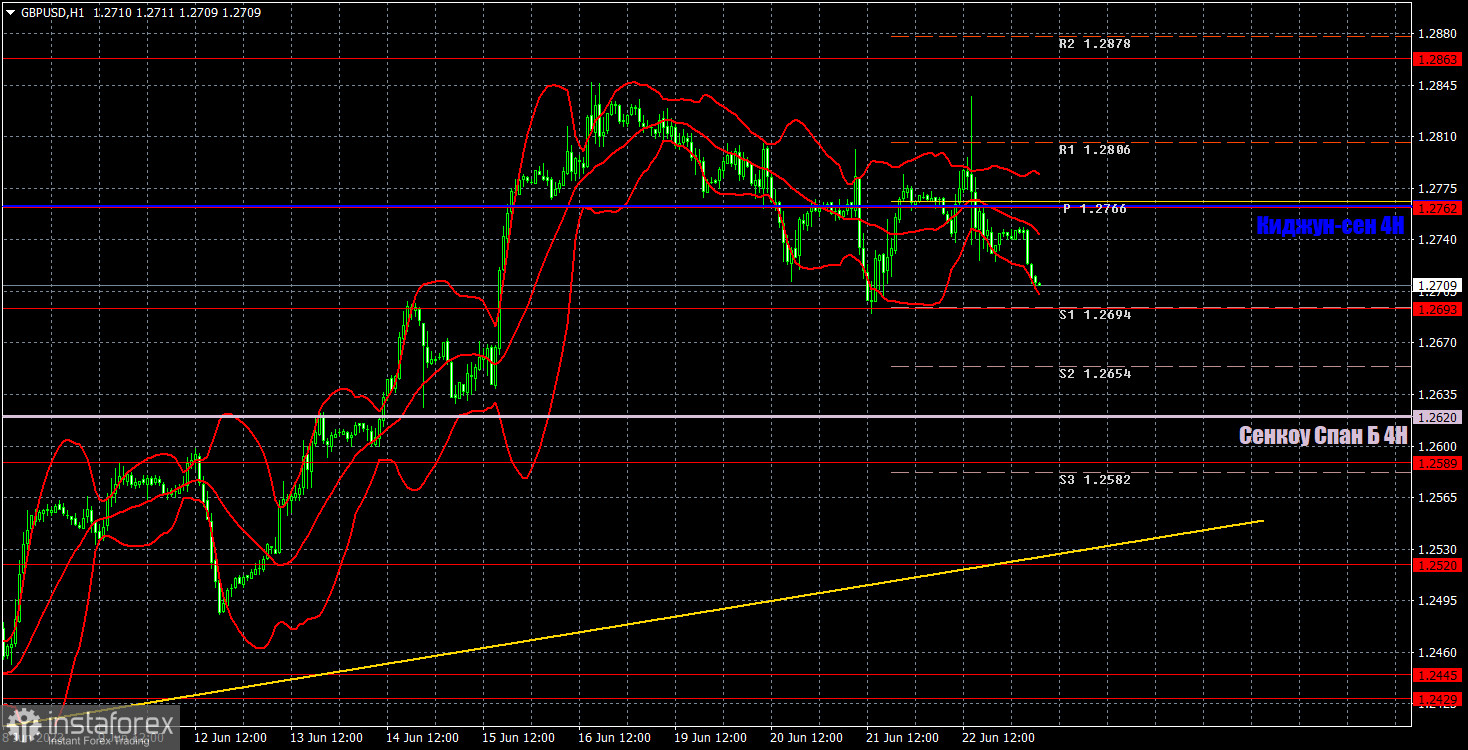
1H chart of GBP/USD
In the 1-hour chart, GBP/USD maintains a bullish bias, although it is correcting at the moment. The ascending trend line serves as a buy signal but I believe that further growth of the British currency is groundless. The pound sterling has been climbing for too long and downward corrections are short-lived (like in the last few days). Judging by the technical indicators, we have an uptrend. You should avoid selling the pair without proper signals. However, at the moment, the price has dropped below the critical line. This gives us hope that it will fall towards the trendline.
On June 23, trading levels are seen at 1.2349, 1.2429-1.2445, 1.2520, 1.2589, 1.2666, 1.2762, 1.2863, 1.2981-1.2987. The Senkou Span B (1.2620) and Kijun-sen (1.2763) may also generate signals when the price either breaks or bounces off them. A Stop Loss should be placed at the breakeven point when the price goes 20 pips in the right direction. Ichimoku indicator lines can move intraday, which should be taken into account when determining trading signals. There are also support and resistance which can be used for locking in profits.
On Friday, PMIs will be released in the UK and the US. In addition to those, the UK will publish a retail sales report. Several Fed officials are also set to deliver speeches today.
Indicators on charts:
Resistance/support - thick red lines, near which the trend may stop. They do not make trading signals.
The Kijun-sen and Senkou Span B lines are the Ichimoku indicator lines moved to the hourly timeframe from the 4-hour timeframe. They are also strong lines.
Extreme levels are thin red lines, from which the price used to bounce earlier. They can produce trading signals.
Yellow lines are trend lines, trend channels, and other technical patterns.
Indicator 1 on the COT chart is the size of the net position of each trader category.
Indicator 2 on the COT chart is the size of the net position for the Non-commercial group of traders.