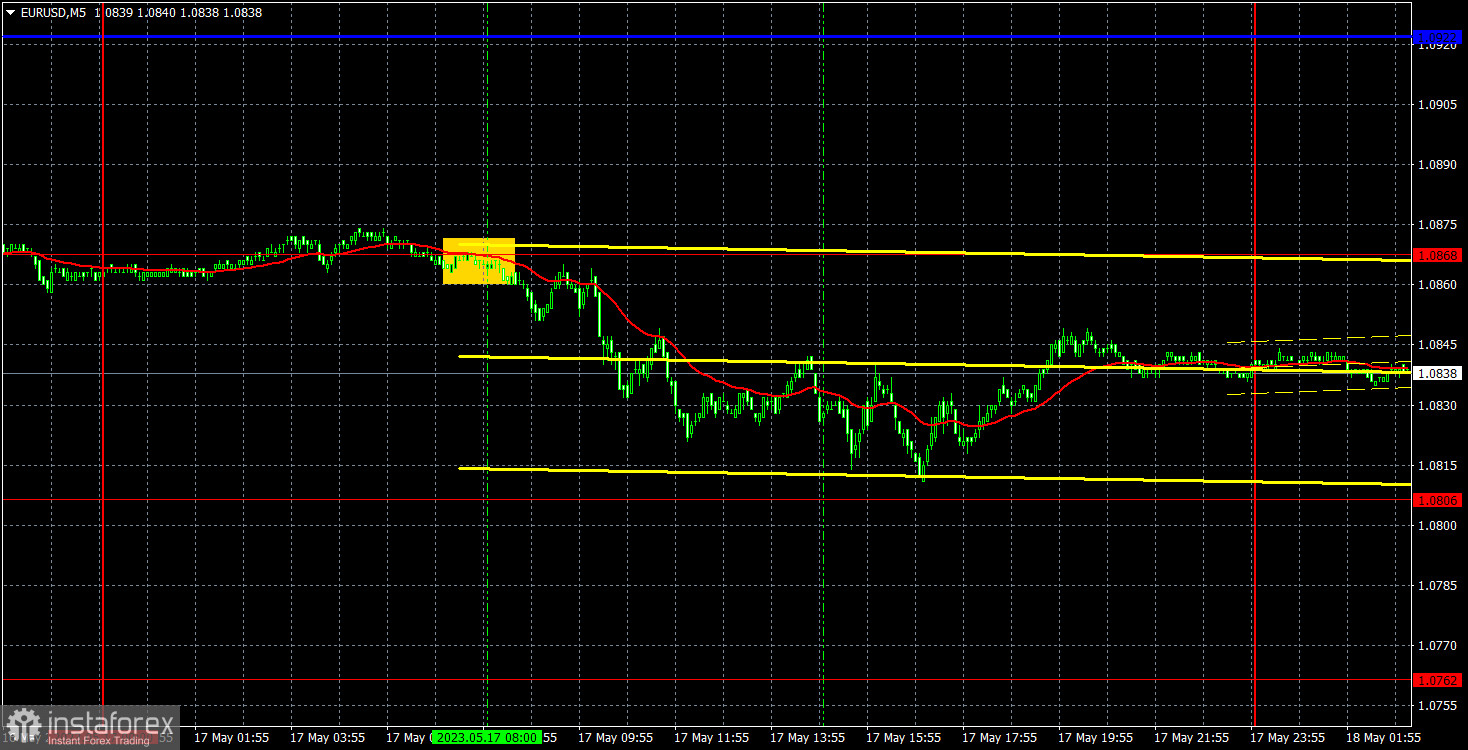
5M chart of EUR/USD
EUR/USD volatility on Wednesday totaled 60 pips. Although this is more than on Monday or Tuesday, it is still very low. I have already mentioned that the weak movement does not even theoretically allow you to earn good profit. Yesterday, the only significant event to take note of was the eurozone inflation report for April. However, when the report was finally published, it became clear that its "significance" was very conditional. The second estimate of the core and headline indicators was no different from the first estimate: the headline sped up to 7%, while the core slowed to 5.6%. Thus, there was nothing for traders to work on.
Speaking of trading signals, traders got lucky. Look at how the pair moved in the second half of the European session and the beginning of the US one. If there had been any level or line in this price area, we would have received a lot of false signals. In practice, there was only one sell signal near the 1.0868 level and by the end of the day it was not canceled. Thus, the position should have been closed manually in the evening, and the profit was about 20 points.
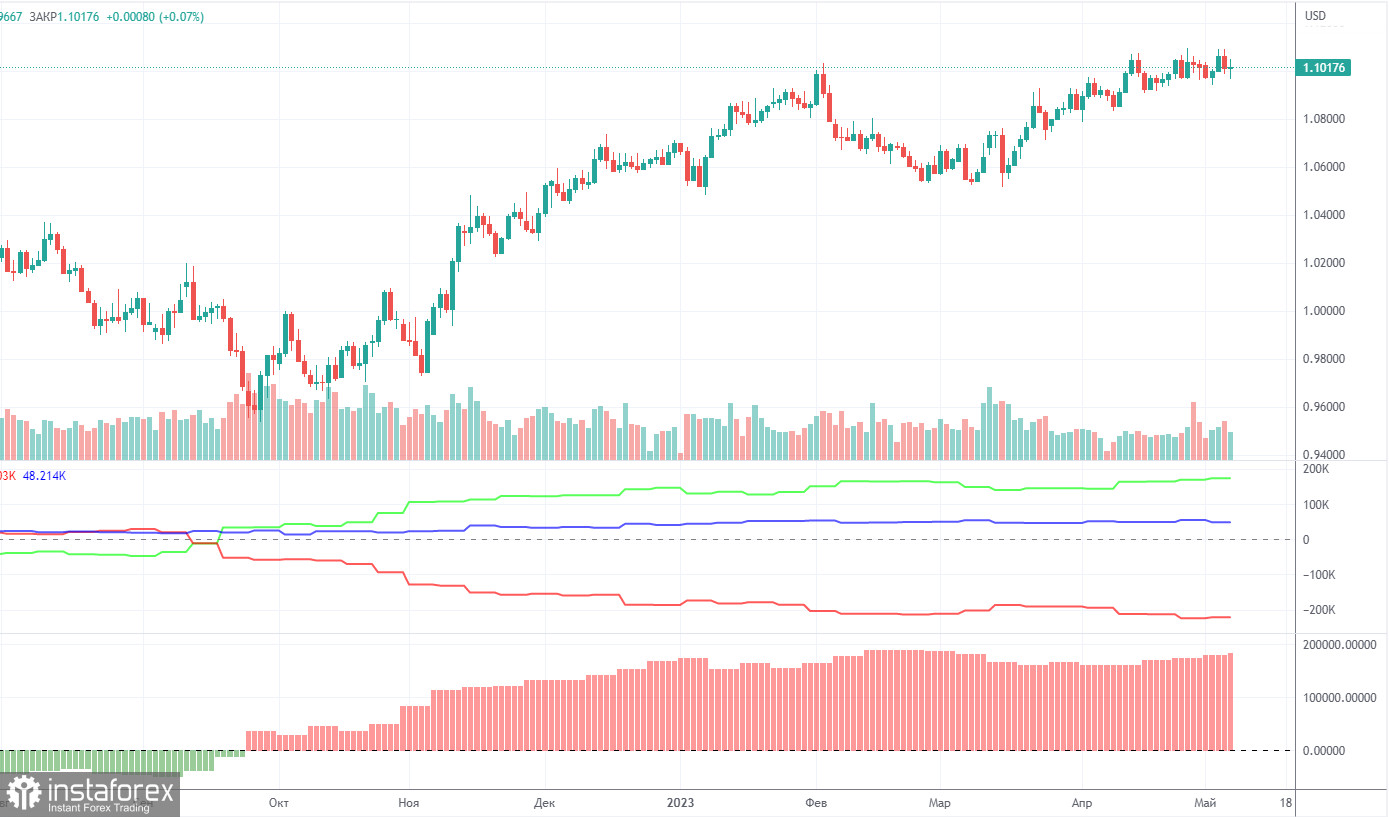
COT report:
According to the COT report from May 9, released on Friday, the net position (second indicator) has been on the rise since September 2022. In fact, COT data has been in line with the developments in the market over the past 9 months. The euro started to show strength approximately at the same time. Currently, the net non-commercial position is bullish and keeps growing further. Likewise, the euro is bullish and without a possibility of a bearish correction.
Notably, judging by the extremely bullish net position, we may assume that the uptrend may soon stop. The first indicator shows that, and the red and green lines are far away from each other, which is usually a sign that the end of the trend might be nearing. The euro attempted to go down several months ago, but those were just minor pullbacks. In the reporting week, long positions of non-commercial traders increased by 13,500 and short positions grew by 7,500. Consequently, the net position rose by 6,000. The number of long positions exceeds that of short ones by 180,000. A correction is still impending. So, it is clear that the pair may soon go down even without COT reports.
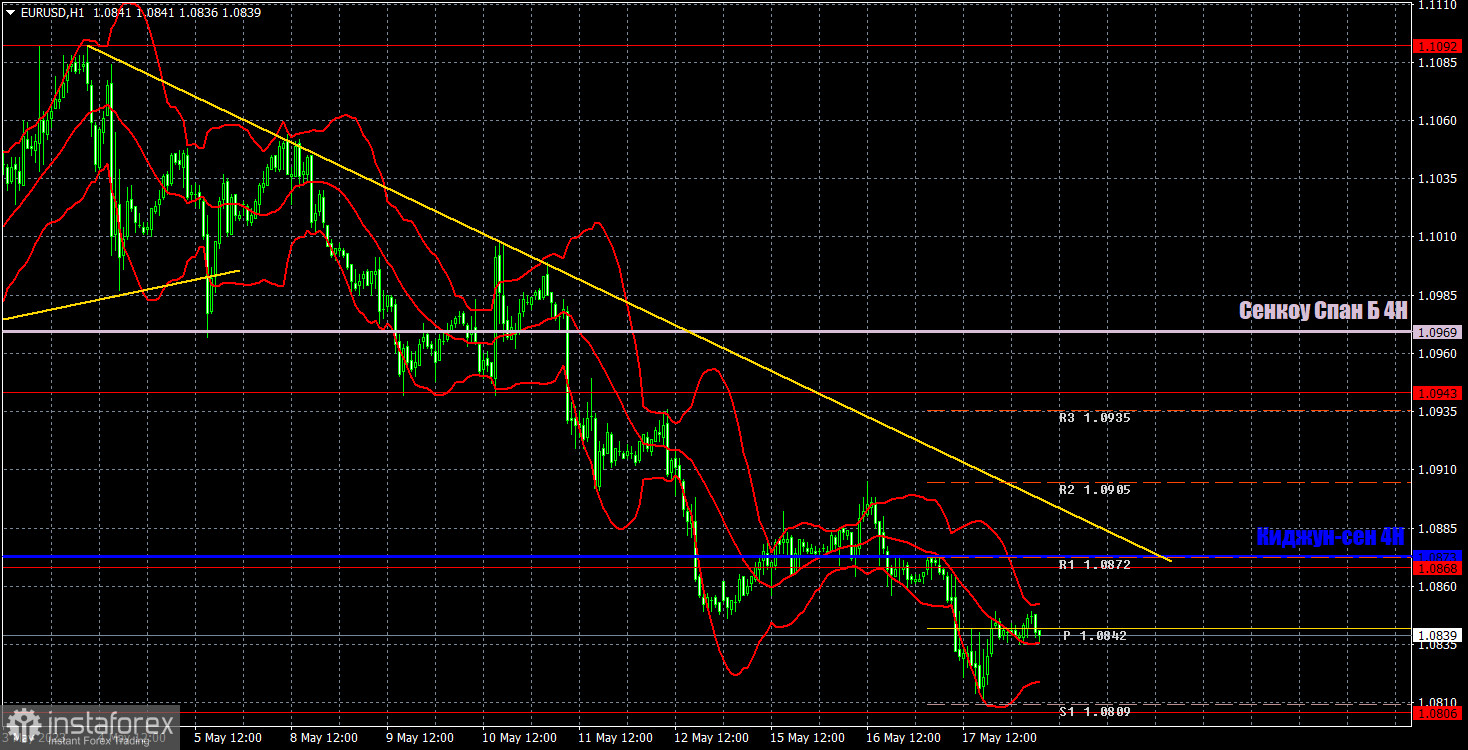
1H chart of EUR/USD
On the 1-hour chart, the pair is moving down, which is supported by the trend line. The greenback will likely keep strengthening against the euro because it is still oversold. All technical indicators signal a downtrend. Meanwhile, the fundamental and macroeconomic backdrop will unlikely provide support for the euro in the coming weeks. A consolidation above the trend line and the critical line could be a signal for the start of a new uptrend.
On Thursday, important levels are seen at 1.0658-1.0669, 1.0762, 1.0806, 1.0868, 1.0943, 1.1092, 1.1137-1.1185, and also Senkou Span B (1.0969) and Kijun Sen (1.0873) lines. Ichimoku indicator lines can move intraday, which should be taken into account when determining trading signals. There are also support and resistance although no signals are made near these levels. They could be made when the price either breaks or rebounds from these extreme levels. Do not forget to place Stop Loss at the breakeven point when the price goes by 15 pips in the right direction. In case of a false breakout, it could save you from possible losses.
The ECB President Christine Lagarde and her deputy Luis de Guindos will speak today in the EU. And those are, in fact, the only events of the day that might be interesting. Over the last week and a half, we have heard a lot of speeches from both the ECB and Fed representatives, and the market did not necessarily react to them. Thus, all speeches are still interesting in terms of understanding the further vector of monetary policy.
Indicators on charts:
Resistance/support - thick red lines, near which the trend may stop. They do not make trading signals.
Kijun-sen and Senkou Span B are the Ichimoku indicator lines moved to the hourly timeframe from the 4-hour timeframe. They are also strong lines.
Extreme levels are thin red lines, from which the price used to bounce earlier. They can produce trading signals.
Yellow lines are trend lines, trend channels, and any other technical patterns.
Indicator 1 on the COT chart is the size of the net position of each trader category.
Indicator 2 on the COT chart is the size of the net position for the Non-commercial group of traders.