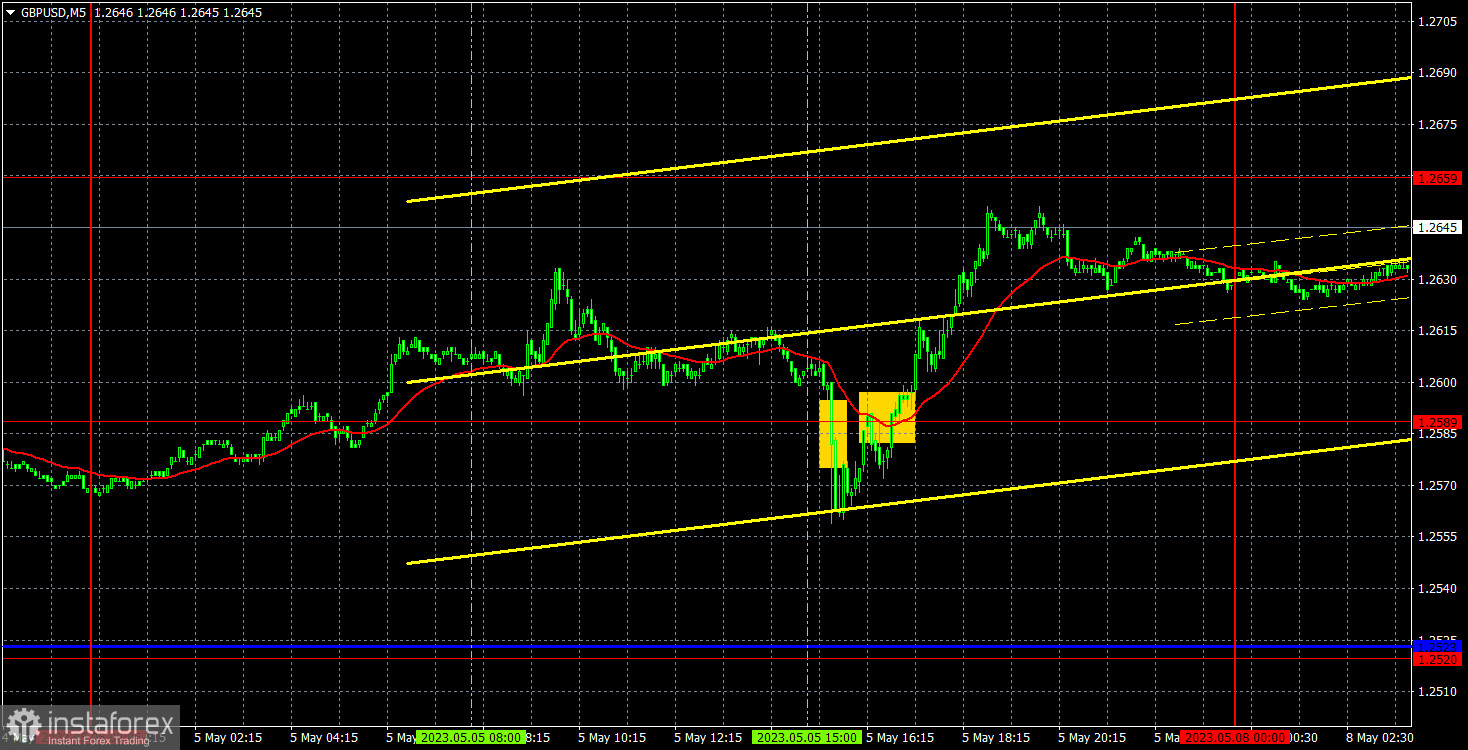
GBP/USD on M5
On Friday, the GBP/USD currency pair had an excellent opportunity to show a downward movement, which would be fully justified by the fundamental and macroeconomic background. But in the end, we saw another increase in the British currency, which is difficult to explain. Even assuming that traders paid attention to the revision of the nonfarm payrolls report for March, the April reading still turned out to be significantly higher than expected. That is, in the worst case scenario, the US dollar should have remained in the same place as before the publication. Besides, the unemployment rate fell to its lowest level in 50 years so the US currency should have shown growth in any case. But once again we have to state that there was no logic in these movements. The pound is still overbought and still growing despite any sell signals.
There were only two trading signals on Friday. First, the pair overcame the level of 1.2589 from above and then from below. The first sell signal should not have been followed since it was formed exactly at the time of the US data publication. The second buy signal allowed us to earn about 30 pips since the pair managed to show a significant rise by the end of the day. The trade had to be closed manually in the late afternoon.
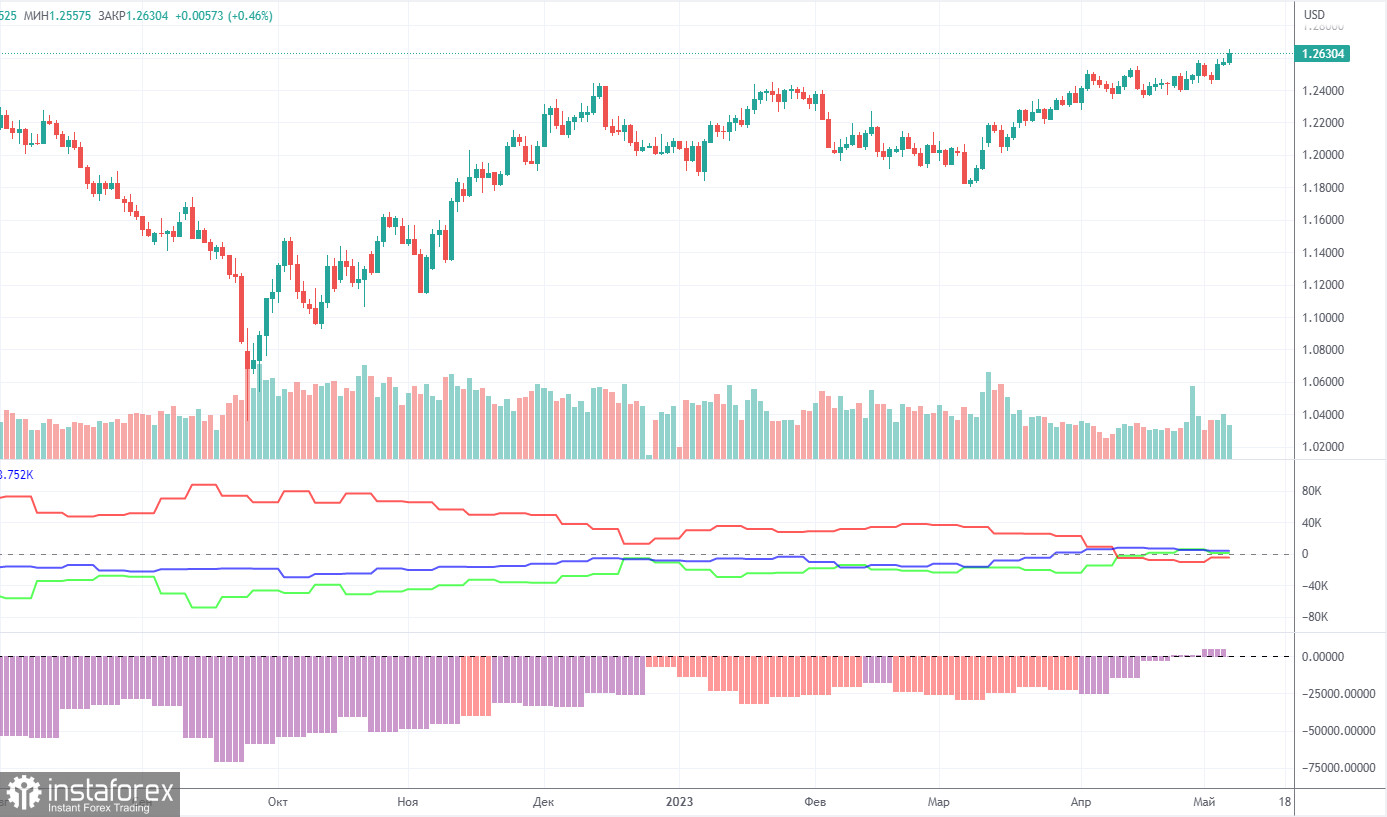
COT report:
According to the latest report on the British pound, the non-commercial group of traders closed 700 BUY contracts and opened 4,000 SELL contracts. Thus, the net position of the non-commercial group of traders decreased by 4,700 but in general, it continues to grow. The net position has been steadily rising for the past 8-9 months, but the sentiment of major market players remained bearish during this time. It has turned slightly bullish just recently. Although the British pound is strengthening against the US dollar in the medium term, it is hard to explain this behavior from the fundamental point of view. There is still the possibility of a sharp decline in the pound.
Both major pairs are moving in a similar way now, but the net position of the euro is positive and even implies the imminent completion of the upward momentum, while the net position of the pound still suggests further growth. The British currency has already risen by more than 2,200 pips, which is a lot, and without a strong downward correction, the continuation of growth would be absolutely illogical. The non-commercial group of traders currently has a total of 58,600 sell contracts and 57,600 buy contracts. I remain skeptical about the long-term growth of the British currency and expect it to decline soon but the market sentiment remains largely bullish.
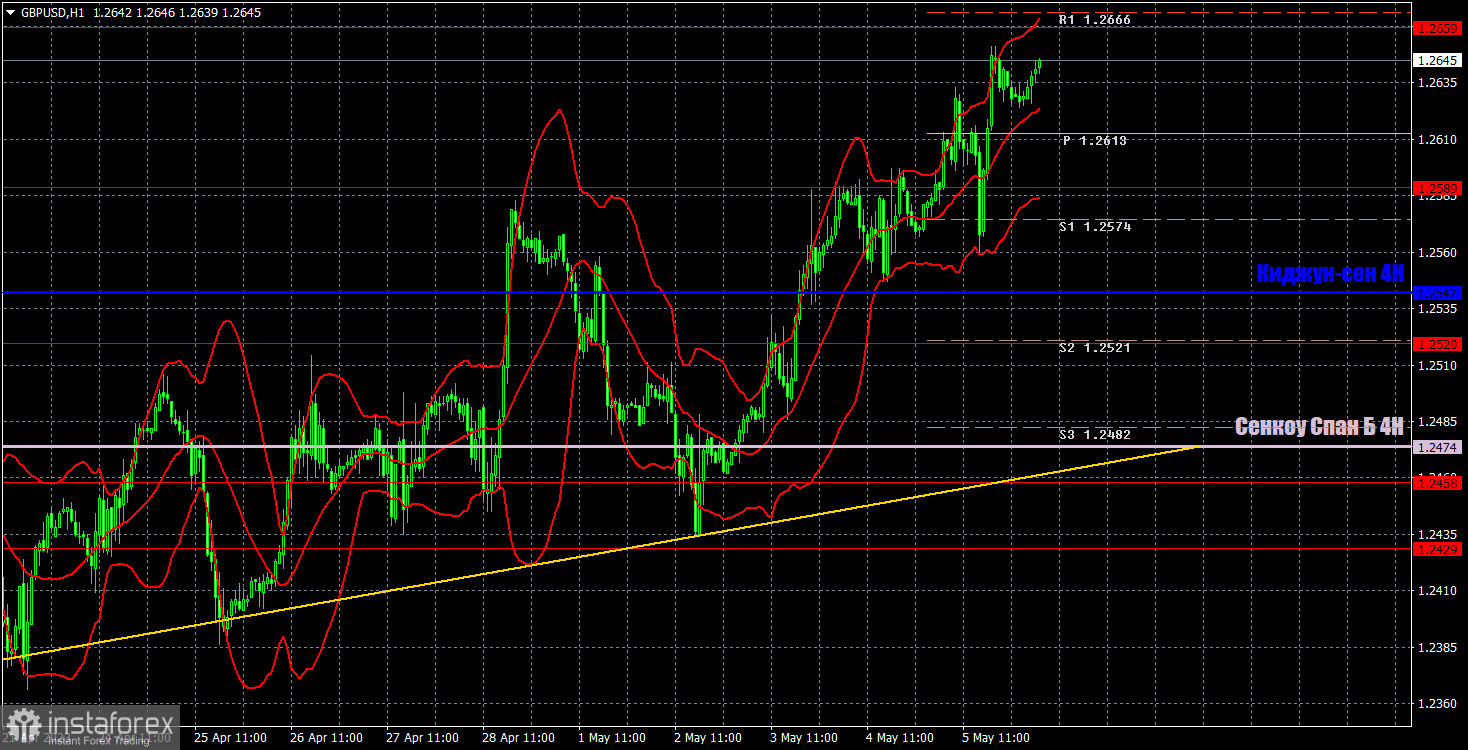
GBP/USD on H1
On the 1-hour chart, GBP/USD resumed its upward movement last week, despite a rate increase by the Fed and positive labor market and unemployment data in the US. However, the US dollar has shown no reaction to the good news so far. It seems that every sell signal at this time indicates that the price is likely to continue to rise. The ascending trendline remains in place, with the price positioned above the next trendline.
The following important levels were highlighted for May 5: 1.2349, 1.2429-1.2458, 1.2520, 1.2589, 1.2659, and 1.2762. Senkou Span B (1.2474) and Kijun-sen (1.2542) lines may also serve as signals. Bounces and breakouts from these levels and lines will also act as trading signals. It is recommended to set a stop-loss order at breakeven when the price moves by 20 pips in the right direction. When looking for trading signals, it is essential to consider that the Ichimoku lines may move during the day. Support and resistance levels are also present in the illustration, which can be used to lock in profits.
On Monday, no major or minor publications are scheduled either in the United Kingdom or the United States. The British pound sterling could well continue to rise even during an uneventful Monday as it currently needs no serious ground for this.
On the chart:
Support and resistance levels are bold red lines at which the price movement may end. They do not provide trading signals.
The Kijun-sen and Senkou Span B lines are the Ichimoku indicator lines plotted on the 1-hour time frame from the 4-hour chart. They are considered strong levels.
Extremum levels are thin red lines from which the price has previously rebounded. They provide trading signals.
Yellow lines are trendlines, trend channels, or other technical patterns.
Indicator 1 on the COT chart is the size of the net position of each category of traders.
Indicator 2 on the COT chart is the size of the net position for the non-commercial group of traders.