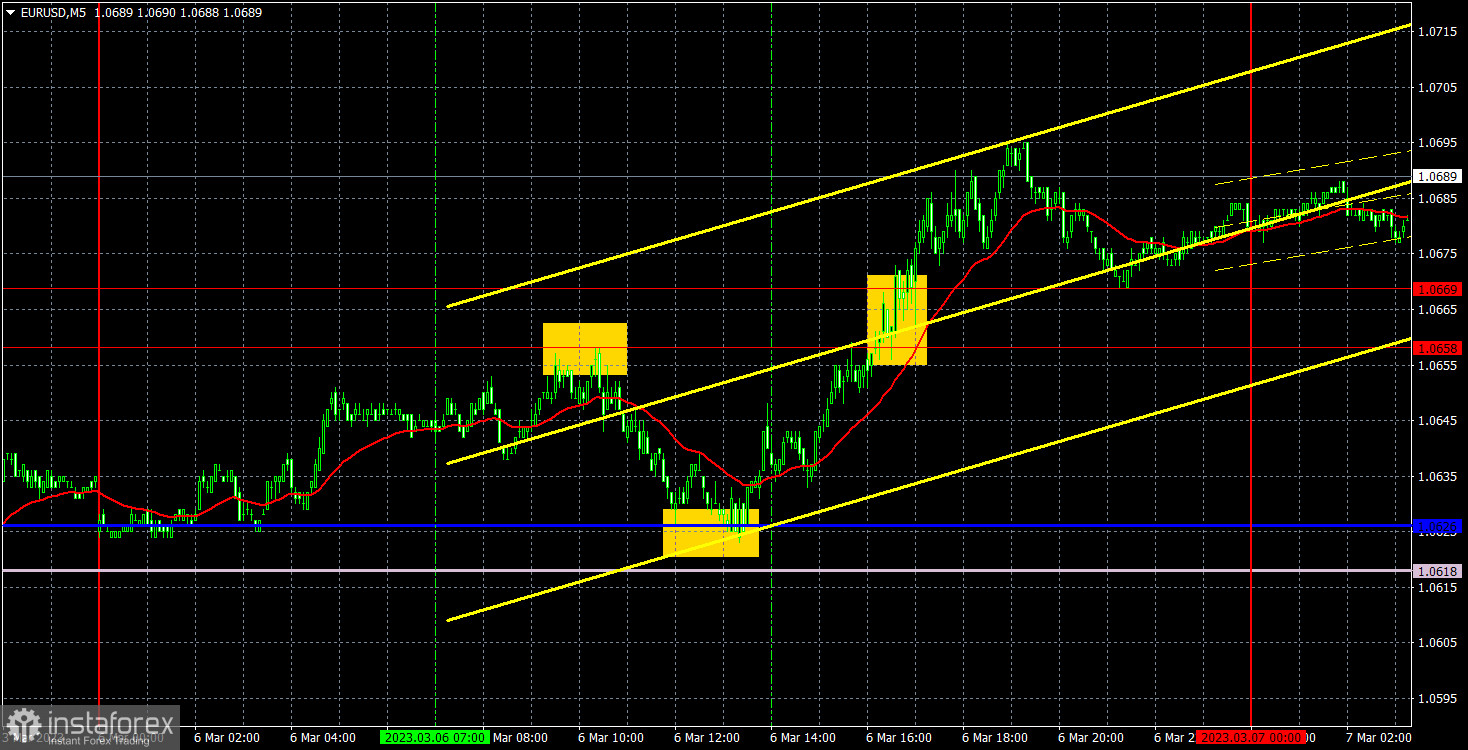
Analysis of EUR/USD, 5-minute chart
On Monday, the euro/dollar pair showed a confident increase. Yesterday, the macroeconomic calendar was not very rich in events. The eurozone published its retail sales report, which was well below the forecast and could not cause a rise in the currency. What is more, Philip Lane provided a speech, thus confirming the words said by Christine Lagarde and other members of the ECB monetary committee. He said that the regulator would continue raising the key rate. The news supported the euro amid an empty macroeconomic calendar. Last week, traders were pricing in the information that the ECB would raise the benchmark rate. That is why the euro's growth on Monday could be explained by technical factors. The pair consolidated above the downward line of the trend, which led to a rise on the one-hour chart. On the 5-minute chart, there were formed three trading signals. Each of them was very accurate. The pair bounced off the level of 1.0658 and dropped below the critical line. Then, it rebounded from the Kijun-sen line and climbed above 1.0658-1.0669, forming one more buy signal. As a result, traders opened both a sell and a buy order. Following a sell signal, they gained 15 pips, whereas the buy order brought about 50 pips in income.
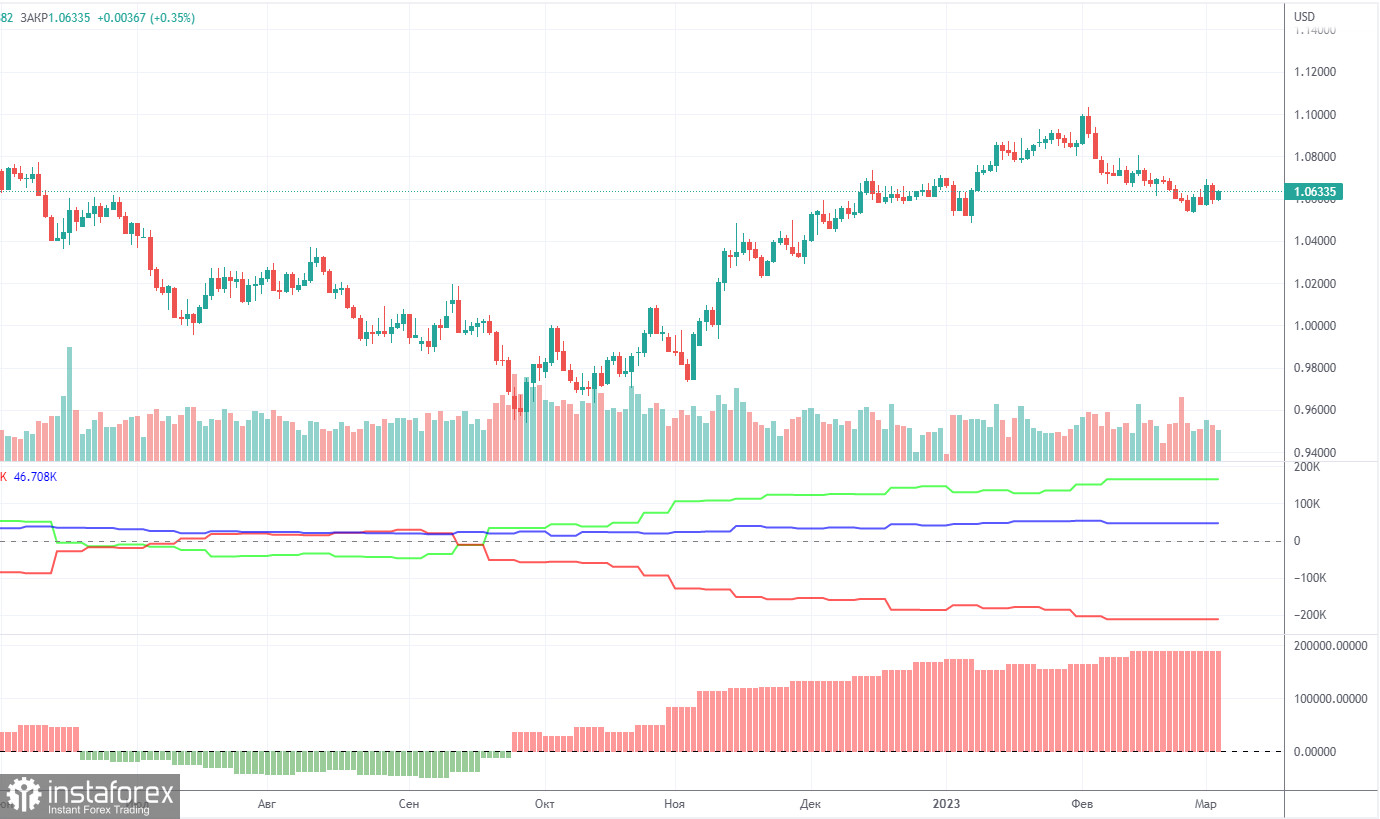
COT report
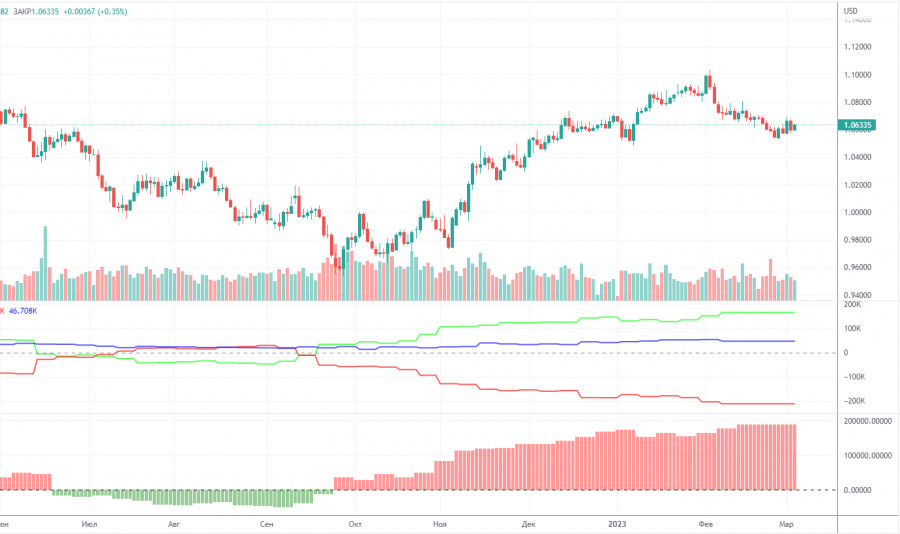
On Friday, traders had to learn once again the COT report from February 7. This report was published a month ago. It seems that the Commodity Futures Trading Commission will now publish reports with a month's delay instead of a three-day delay as it was before. In the event of this, the reports will hardly be of great importance. However, we will continue to analyze them. Maybe in the future, the situation will change for the better. So far, we can say that in the last few months, the overall picture has been corresponding to the market situation. On the chart above, we see that the net non-commercial position of large traders (second indicator) has risen since September 2022. The net non-commercial position is bullish and continues to increase with each new week, allowing us to expect the uptrend to stop shortly. Such a signal comes from the first indicator, with the green line and the red line being far apart, which is usually a sign of the end of a trend. The euro has already begun its bearish move against the greenback. So far, it remains unclear whether it is just a downward correction or a new downward trend. According to the latest report, non-commercial traders closed 8,400 long positions and 22,900 short ones. Consequently, the net position rose by 14,500. The number of long positions exceeds that of short ones by 165,000. In any case, a correction has been looming for a long time. Therefore, even without reports, it is clear that the downtrend will continue.
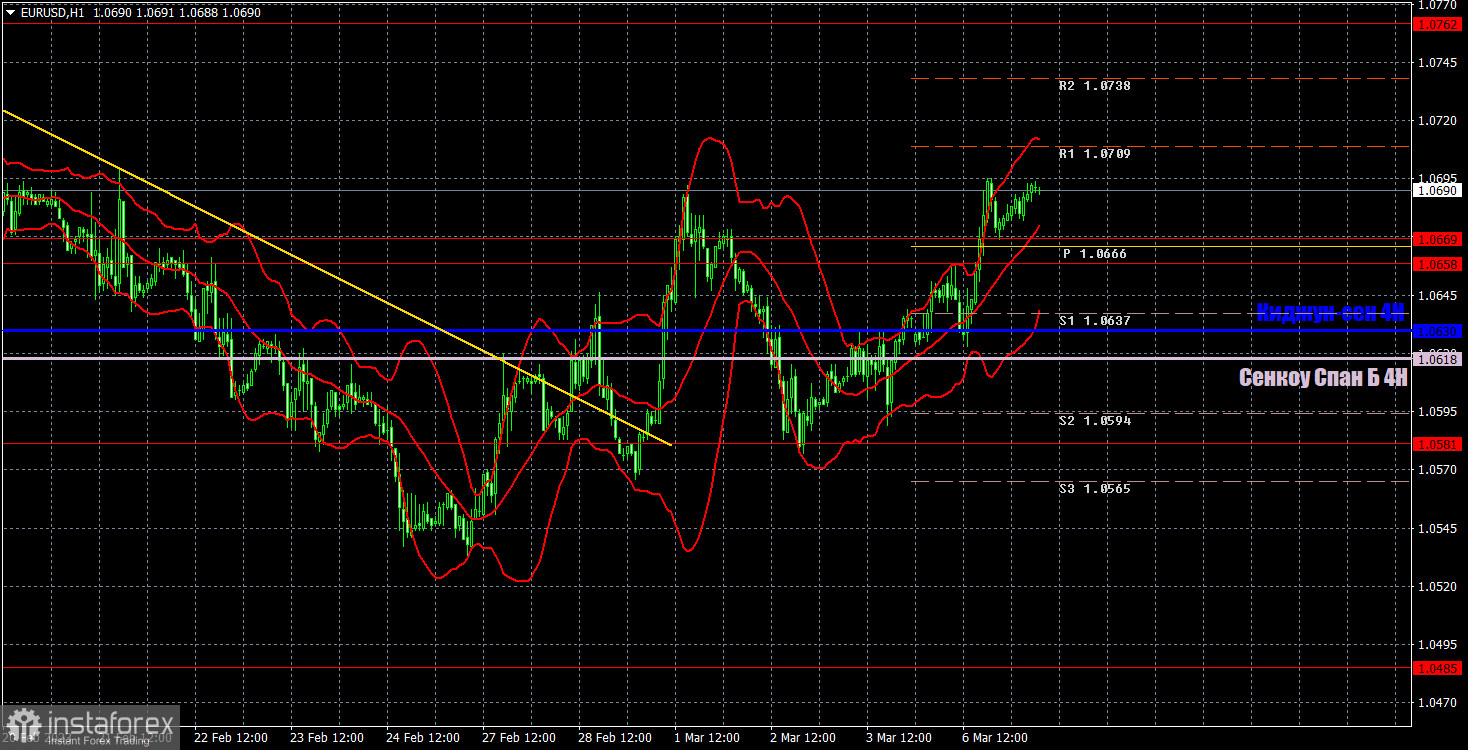
Analysis of EUR/USD, 1-hour chart
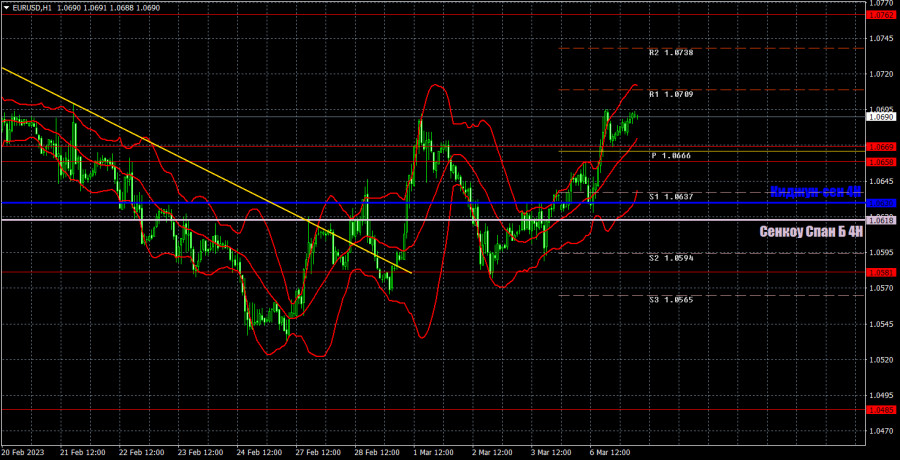
On the one-hour chart, the pair is making an attempt to prolong its upward movement. It is not working out too well. Notably, a correction cannot be stronger than the main trend. The current correctional process may end soon or become a bit longer. This week is rich in macroeconomic events. A lot will depend on speeches that will be provided by Christine Lagarde and Jerome Powell. On Tuesday, traders should focus on the following levels: 1.0340-1.0366, 1.0485, 1.0581, 1.0658-1.0669, 1.0762, 1.0806, 1.0868, as well as the Senkou Span B (1.0618) and Kijun-sen (1.0630) lines. The lines of the Ichimoku indicator can move during the day, which should be taken into account when determining trading signals. There are also support and resistance levels, but trading signals are not formed near them. Breakouts and rebounds from these levels could be used as signals. Do not forget to place a stop-loss order at breakeven if the price goes in the right direction by 15 pips. This will protect against possible losses if the signal turns out to be false. On March 7, Jerome Powell's testimony in the US Congress is the most important event of the day. A lot depends on the Fed Chair's comments. However, he may not provide new information.
What we see on the trading charts:
Price levels of support and resistance are thick red lines, near which the movement may end. They do not provide trading signals.
The Kijun-sen and Senkou Span B lines are the lines of the Ichimoku indicator, moved to the one-hour chart from the 4-hour one. They are strong lines.
Extreme levels are thin red lines from which the price bounced earlier. They provide trading signals.
Yellow lines are trend lines, trend channels, and any other technical patterns.
Indicator 1 on the COT charts reflects the net position size of each category of traders.
Indicator 2 on the COT charts reflects the net position size for the non-commercial group.