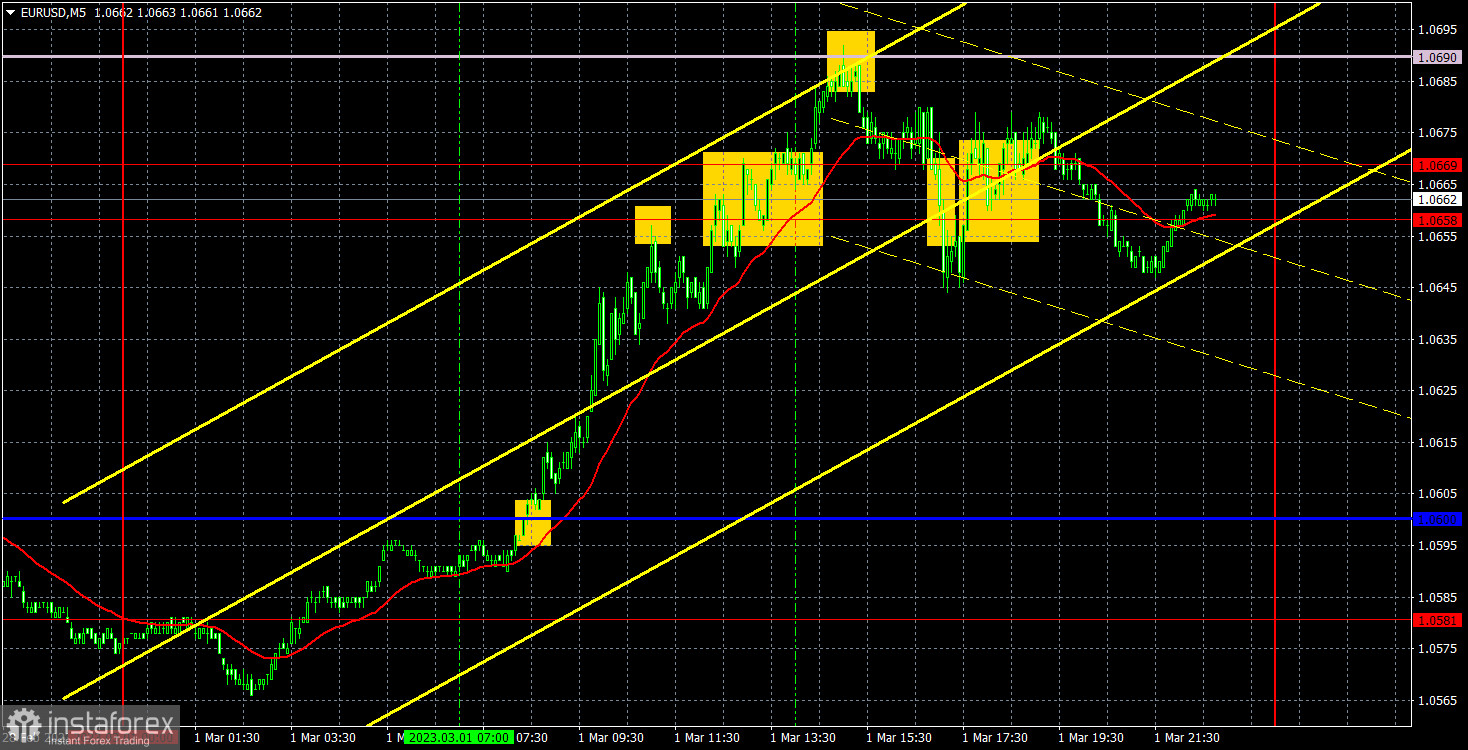
5M chart of EUR/USD
EUR/USD continued to rise on Wednesday. Yesterday, there were quite specific reasons for such a movement, although they can be questioned. For instance, yesterday, Germany published its inflation report, which showed that there was no slowdown. And last month, it was rising almost to its peak. Thus, prices are not slowing down in the EU's largest economy and traders can expect a slowdown in the rate of decline of pan-European inflation. This will only mean that the European Central Bank needs to keep up its momentum and keep raising the rate as fast as it can. Naturally, it is a bullish factor for the euro. Joachim Nagel also gave a speech stating that the monetary tightening cycle may last much longer than it is expected now. This is also a bullish factor for the euro. The only problem is that the euro rose on Wednesday first, and then there was a speech and the release of the report...
Technical signals can be divided into the European and the US sessions. At the European session, there was a buy signal near the critical line, afterwards the pair rose to 1.0658. The price rebounded from the level, so the long position should have been closed at that moment. Profit at 35 pips. The sell signal at 1.0658 also should have been executed, but it turned out to be false and brought in a loss of 25 pips. The price started to move from side to side, the signals were formed often and were mostly false. The levels 1.0658, 1.0669 and 1.0690 were very close to each other, so we shouldn't open any positions between them. When the sell signal formed when the pair settled below 1.0658, the ISM report was released in the US, so we should have ignored that one too. Moreover, the initial reaction to it was illogical.
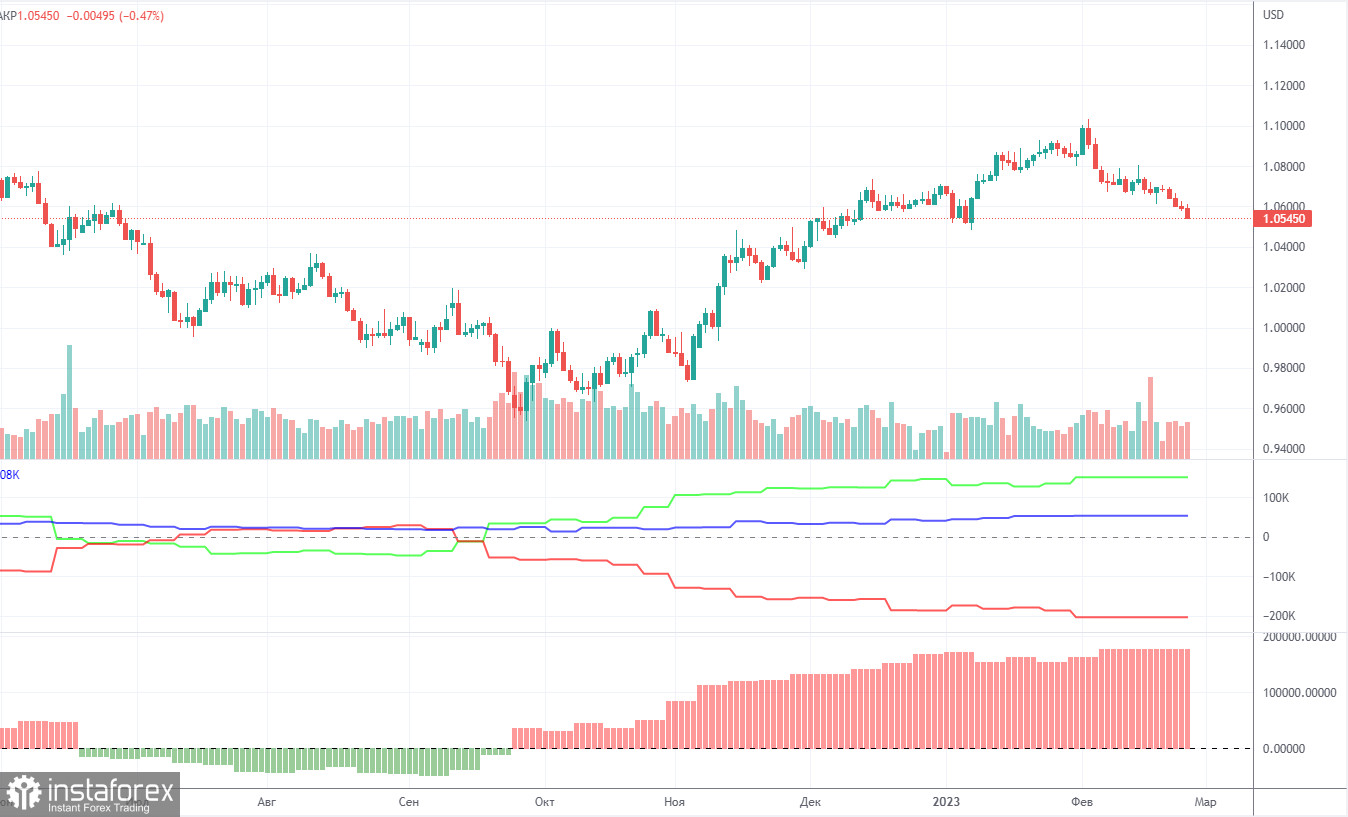
COT report:
Due to a technical glitch, new COT reports have not been released for almost a month, but on Friday, one of the reports for January 31 was released. This report does not make much sense, because since then, a month has passed, and the data from the next reports (which are more or less up-to-date) are still not available. Therefore, we will analyze the data that are available. The COT reports on EUR/USD have been in line with expectations in recent months. The net non-commercial position has been on the rise since September. Around the same time, the euro started to rise. The bullish non-commercial position rises with each new week. Taking into account this fact, we may assume that the uptrend will soon come to an end. The red and green lines of the first indicator are far apart, which is usually a sign of the end of a trend. The euro has already started to fall, but it is not clear yet, is it a pullback or a new downtrend? In the reporting week, non-commercial traders opened 9,000 long positions while the number of shorts decreased by 7,100. Correspondingly, the net position increased by 16,100. The number of long positions exceeds that of short ones by 148,000. In any case, a correction has been looming for a long time. Therefore, even without reports, it is clear that the downtrend will continue.
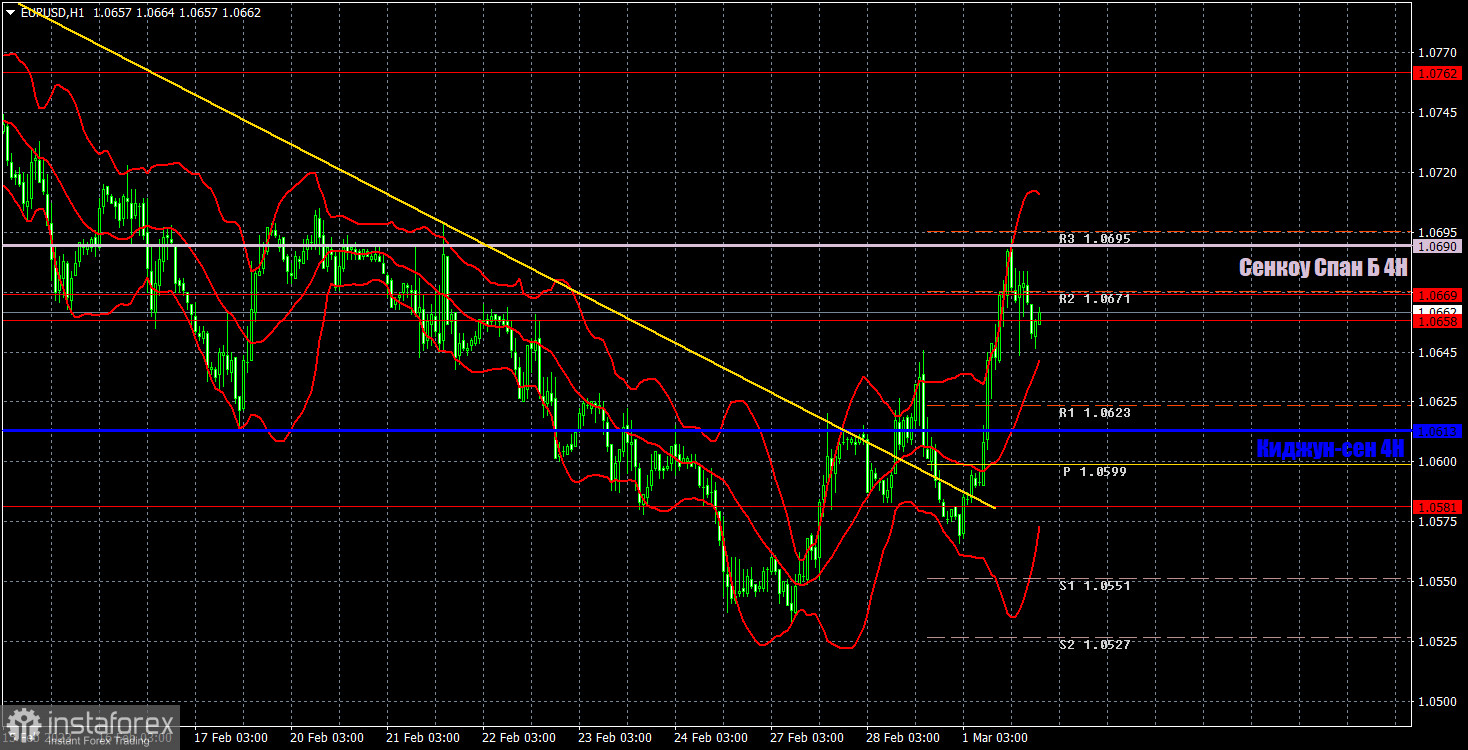
1H chart of EUR/USD
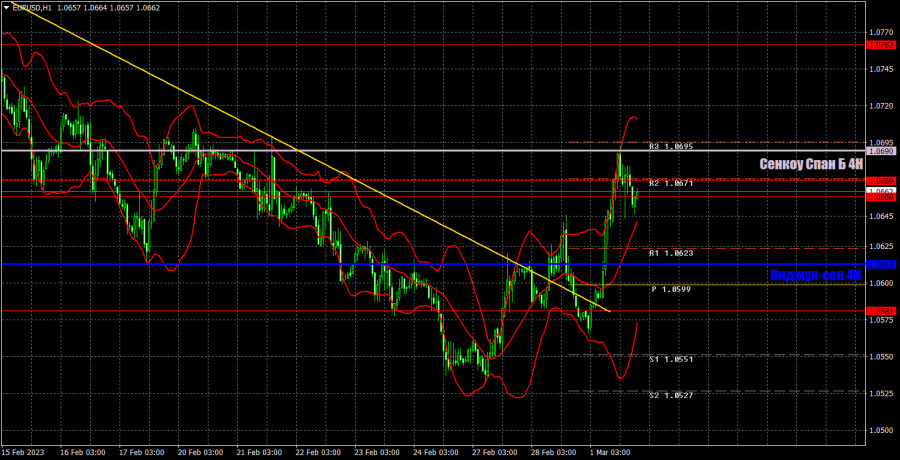
On the one-hour chart, the trend is shifting upward. The trend below the Senkou Span B line isn't completely canceled, but the fact that the pair settles above the critical line and the trend line already says a lot. Therefore, until it overcomes the Senkou Span B line, the pair can still restore the downtrend. On Thursday, important levels are seen at 1.0340-1.0366, 1.0485, 1.0581, 1.0658-1.0669, 1.0762, 1.0806, and also Senkou Span B (1.0690) and Kijun Sen (1.0613). Ichimoku indicator lines can move intraday, which should be taken into account when determining trading signals. There are also support and resistance although no signals are made near these levels. They could be made when the price either breaks or rebounds from these extreme levels. Do not forget to place Stop Loss at the breakeven point when the price goes by 15 pips in the right direction. In case of a false breakout, it could save you from possible losses. On March 2, the ECB will publish the most important inflation report for February. The ECB and the Fed will also deliver some speeches. The day promises to be very interesting.
Indicators on charts:
Resistance/support - thick red lines, near which the trend may stop. They do not make trading signals.
Kijun-sen and Senkou Span B are the Ichimoku indicator lines moved to the hourly timeframe from the 4-hour timeframe. They are also strong lines.
Extreme levels are thin red lines, from which the price used to bounce earlier. They can produce trading signals.
Yellow lines are trend lines, trend channels, and any other technical patterns.
Indicator 1 on the COT chart is the size of the net position of each trader category.
Indicator 2 on the COT chart is the size of the net position for the Non-commercial group of traders.