M5 chart of GBP/USD
GBP/USD also started a new round of downward movement and failed to surpass the important Senkou Span B Line, although it did not settle below the critical line either. I have the same expectations for both the pound and the euro - a systematic decline by a few hundred points. The central banks' rhetoric next month, as well as the decisions which will be made at the next meeting will be very important for the euro, the pound and the dollar. That is why the market is calm for now. Yesterday, for instance, there were no interesting events in the UK or in the US. The FOMC minutes in the evening did not add any clarity to the central bank's future actions. However the GBP grew this week on strong UK business activity statistics, so now it "returns the favor".
The pound's trading signals were almost identical to those of the euro. The pair bounced twice from the extremum level of 1.2106, next to which is the Senkou Span B line. Initially, the pair also managed to settle above this line so traders could open a long position first. But the upward movement did not last long, so there was a loss on the long position. The pair went down about 30 pips on the sell signal, which allowed traders to place a Stop Loss at breakeven, which was used to close the position. The next rebound from the marked area could not be priced, as the first two signals were false. Ironically, it was the strongest signal, which could bring profit. As a result, the day was not very successful.
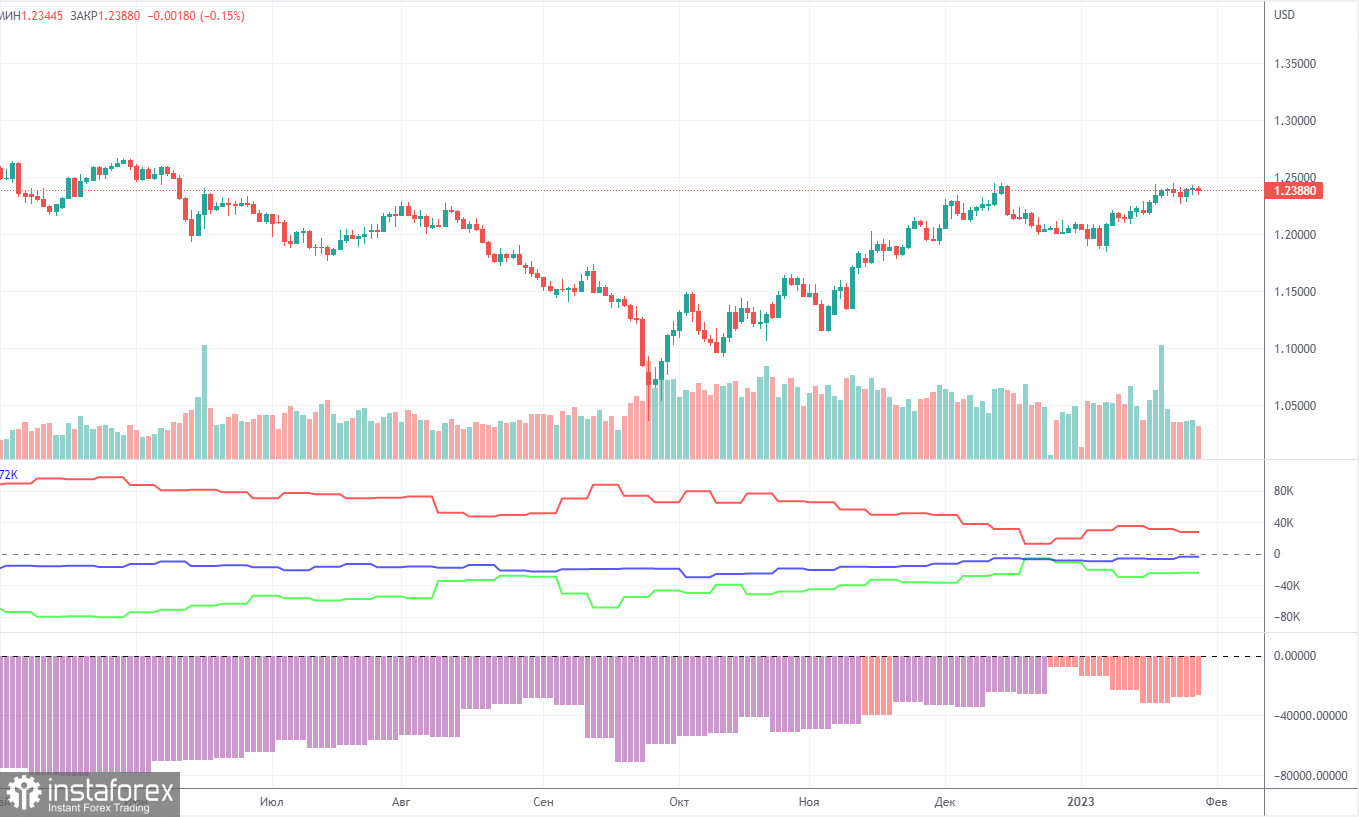
COT report:
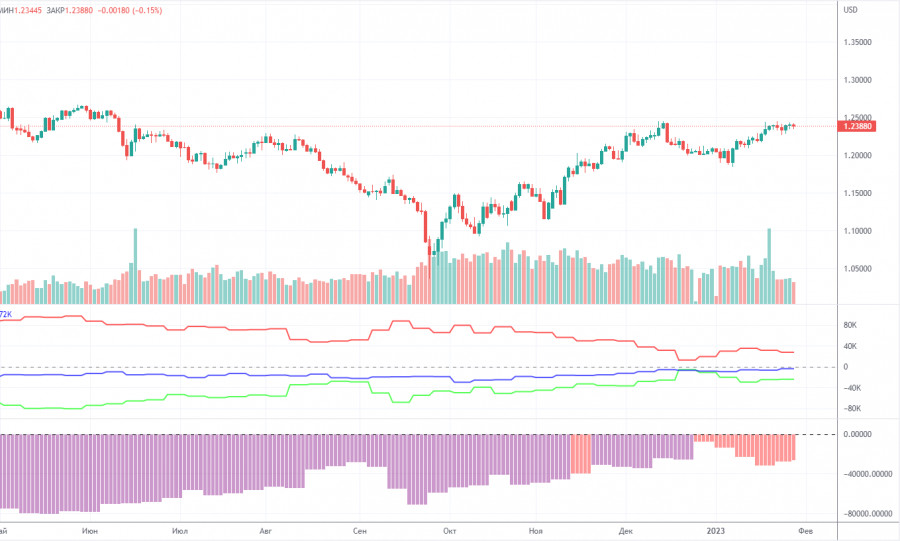
The latest COT report on the British pound showed that the market sentiment has become less bearish. In a week, the non-commercial group of traders closed 6,700 buy contracts and 7,500 sell contracts. As a result, the non-commercial net position increased by 800. The value of the net position has been steadily rising in recent months. So, in the near future, large market players may become more bullish on the pair. It is very hard to say from the fundamental point of view why the pound has advanced so much against the US dollar. It is very likely that in the medium term, the pound will extend its decline as there is still the need for a correction. In general, COT reports have been in line with the trajectory of the pound, so it is all quite logical. Since the net position has not turned bullish yet, traders may continue to buy the pound on condition that the fundamental background is strong enough. The non-commercial group of traders has a total of 35,000 opened buy contracts and 59,000 sell contracts. I am still rather skeptical about the long-term uptrend in the pound. The fundamental and geopolitical backgrounds do not favor a strong and swift rise in the British currency.
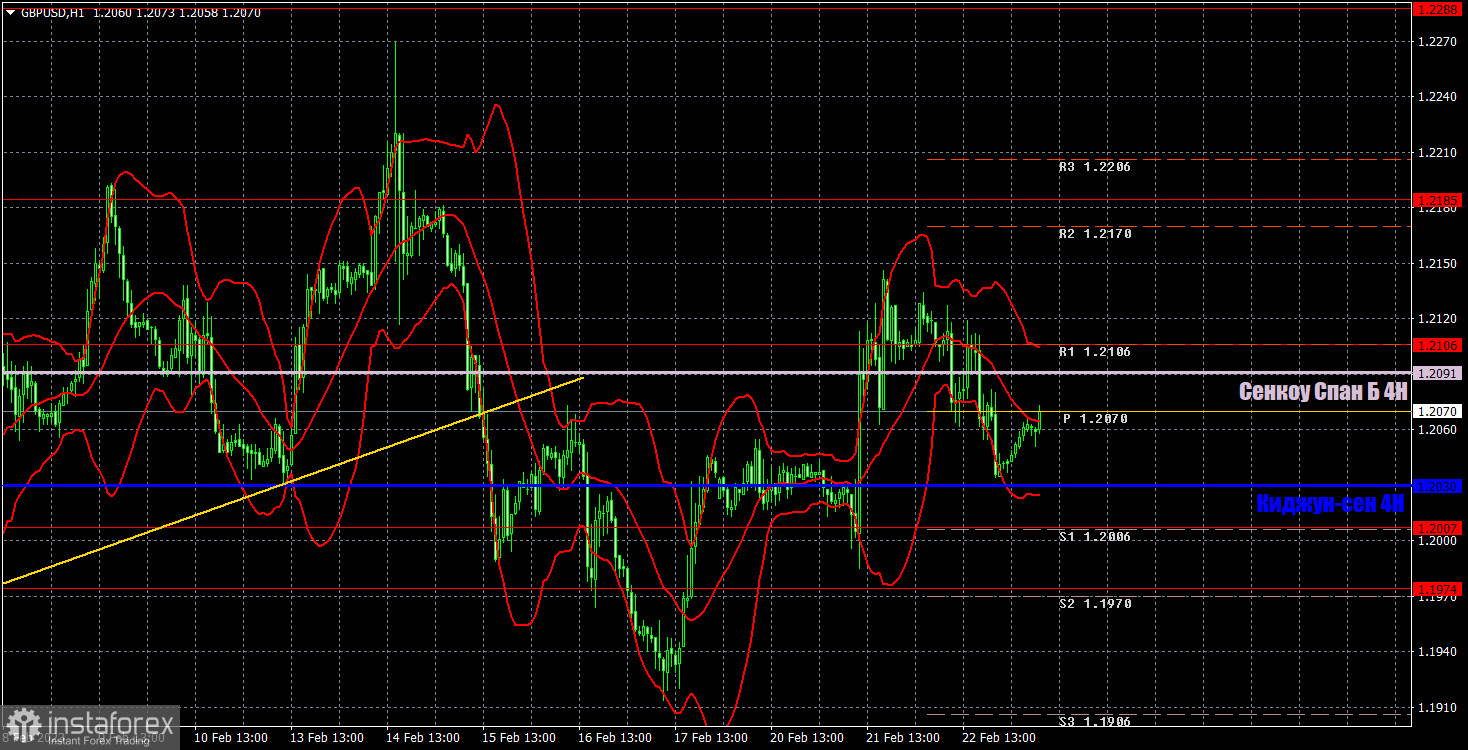
H1 chart of GBP/USD
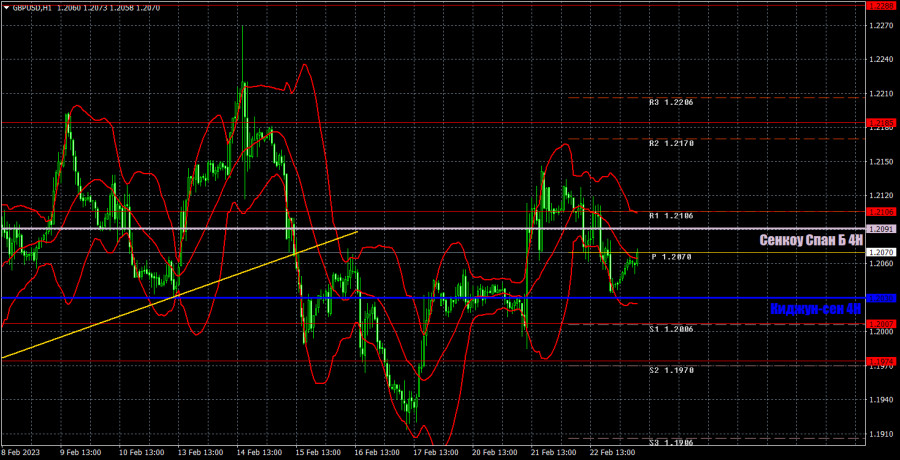
On the one-hour chart, GBP/USD demonstrated a new upward movement and reached the important Senkou Span B line. Once again, it failed to overcome it, and this is the second unsuccessful attempt to settle above it. Therefore, it would be better to stick with the bearish mood. On February 23, it is recommended to trade at the key level of 1.1760, 1.1874, 1.1974-1.2007, 1.2106, 1.2185, 1.2288, 1.2342, 1.2429. The Senkou Span B (1.2091) and Kijun Sen (1.2030) lines can also generate signals. Rebounds and breakouts from these lines can also serve as trading signals. It is better to set the Stop Loss at breakeven as soon as the price moves by 20 pips in the right direction. The lines of the Ichimoku indicator can change their position throughout the day which is worth keeping in mind when looking for trading signals. On the chart, you can also see support and resistance levels where you can take profit. On Thursday, there are no important events planned for Great Britain, and in the United States. Only minor data and the report on GDP in the second estimate for the fourth quarter, which is unlikely to bring out a market reaction.
Indicators on charts:
Resistance/support - thick red lines, near which the trend may stop. They do not make trading signals.
Kijun-sen and Senkou Span B are the Ichimoku indicator lines moved to the hourly timeframe from the 4-hour timeframe. They are also strong lines.
Extreme levels are thin red lines, from which the price used to bounce earlier. They can produce trading signals.
Yellow lines are trend lines, trend channels, and any other technical patterns.
Indicator 1 on the COT chart is the size of the net position of each trader category.
Indicator 2 on the COT chart is the size of the net position for the Non-commercial group of traders.