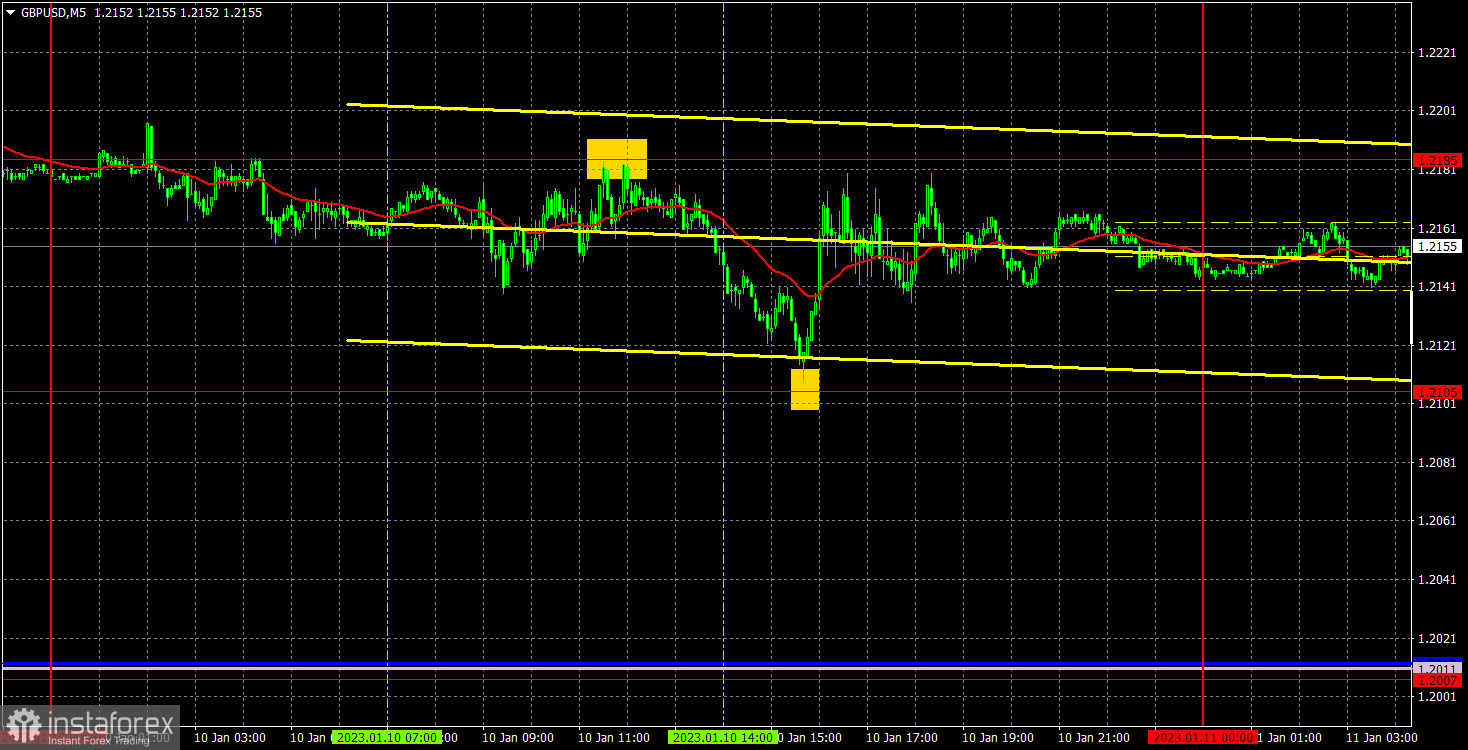
M5 chart of GBP/USD
GBP/USD started a weak correction on Tuesday after two days of growth, but the most it could achieve was a descent to the extremum level of 1.2106. Yesterday was a blank day in terms of macro data and fundamental events. Federal Reserve Chairman Jerome Powell's speech was devoted to climate issues, and not a single word was said about monetary policy. Naturally, forex traders are not too interested in climate change issues. During the day, the pair showed some interesting moves, but on the whole it traded sideways. I expect GBP to fall because it has corrected enough to resume its decline now. Also, I believe that the market's reaction last Friday was totally illogical, so now it should be offset.
Speaking of trading signals, the picture was almost perfect, despite the flat. First, the pair bounced with a slight error of 1 pip from 1.2185. At that point traders could open short positions. Then it went down to 1.2106, from which it also bounced with minimum error. At this point it was possible to close the shorts and open the longs. By the end of the day, the pair almost returned to 1.2185, but it did not work out so longs had to be closed manually. Profit was 45 pips on the first deal, and it was about 30 pips on the second deal. Thus, it was possible to earn good profit in a flat.
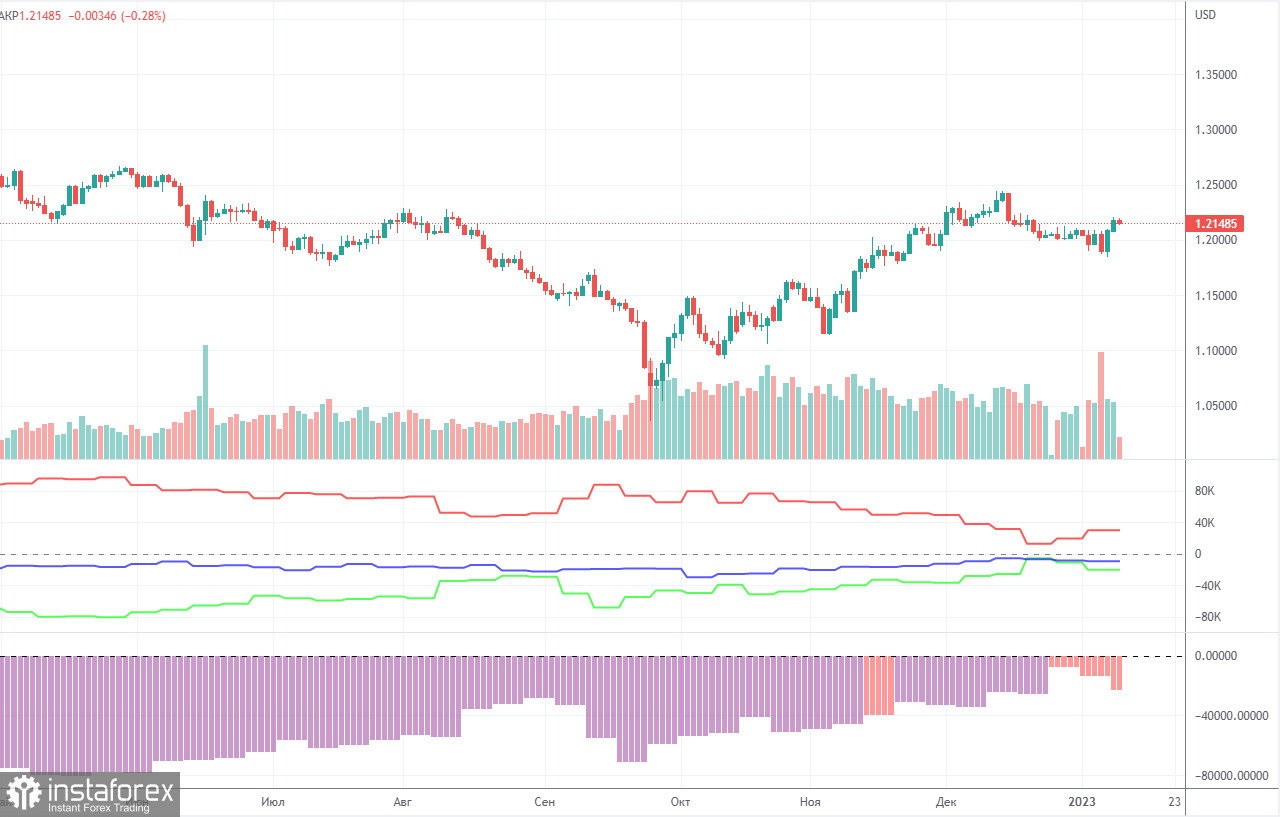
COT report
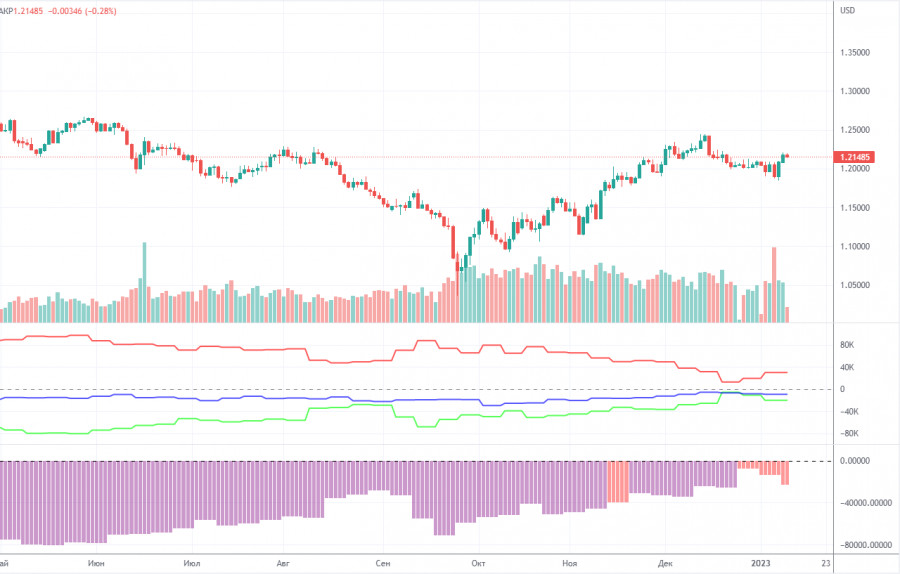
The latest COT report showed an increase in bearish sentiment. During the given period, non-commercial traders opened 3,000 long positions and as many as 12,400 short positions. Thus, the net position fell by about 9,400. This figure has been on the rise for several months, and the sentiment may become bullish in the near future, but it hasn't yet. Although the pound has grown against the dollar for the last few months, from a fundamental perspective, it is still difficult to answer why it keeps rising. On the other hand, it could fall in the near future (in the mid-term prospect) because it still needs a correction. In general, in recent months the COT reports correspond to the pound's movements so there shouldn't be any questions. Since the net position is not even bullish yet, traders may continue to buy the pair over the next few months. Non-commercial traders now hold 43,600,000 long positions and 63,900 short ones. I remain skeptical about the pound's long term growth, though there are technical reasons for it. At the same time, fundamental and geopolitical factors signal that the currency is unlikely to strengthen significantly.
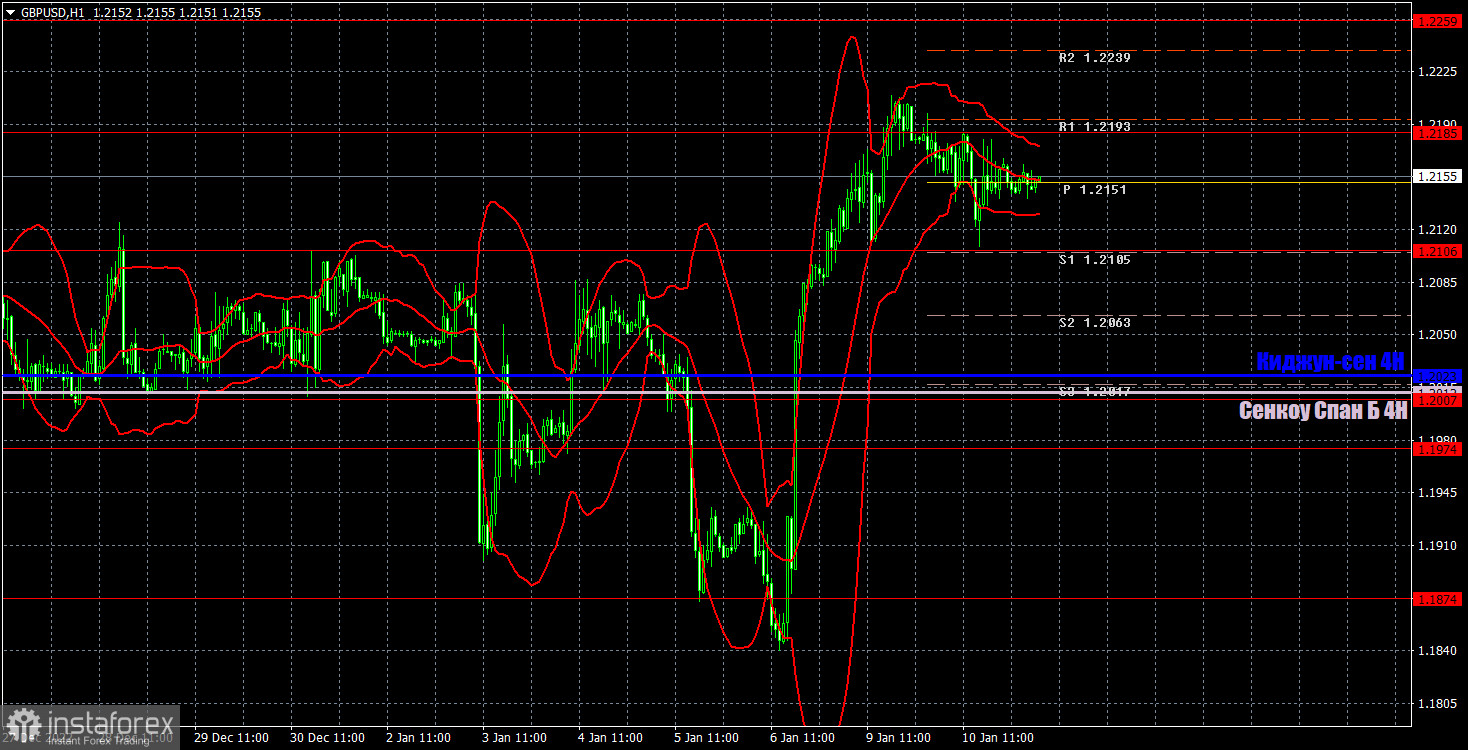
H1 chart of GBP/USD
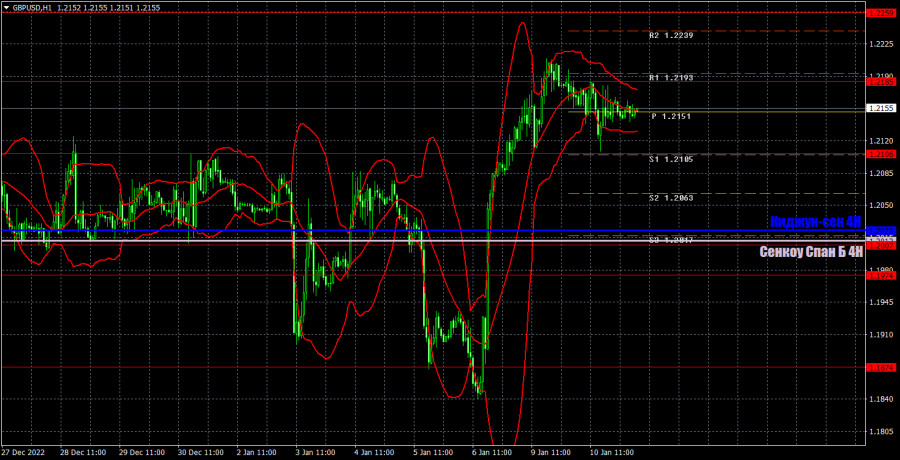
On the one-hour chart, GBP/USD has risen sharply, but so far it doesn't have any grounds for the continuation of growth. I assume that traders may start to buy the euro and pound again without any reason, but if we pay attention to the fundamentals and macroeconomics, the British currency should fall, not grow. Also, we are also considering the possibility that a "swing" could start, which we expected a bit later. On January 11, the pair may trade at the following levels: 1.1760, 1.1874, 1.1974-1.2007, 1.2106, 1.2185, 1.2259, 1.2342, 1.2429-1.2458. The Senkou Span B (1.2012) and Kijun Sen (1.2023) lines may also generate signals. Pullbacks and breakouts through these lines may produce signals as well. A Stop Loss order should be set at the breakeven point after the price passes 20 pips in the right direction. Ichimoku indicator lines may move during the day, which should be taken into account when determining trading signals. In addition, the chart does illustrate support and resistance levels, which could be used to lock in profits. On Wednesday, there are no important events in the UK and the US, so there will be nothing for traders to react to during the day. Consequently, the flat may persist and volatility may be low. If the "swing" has started, the pair may continue to move with the 1.1874 target for no reason.
What we see on the trading charts:
Price levels of support and resistance are thick red lines, near which the movement may end. They do not provide trading signals.
The Kijun-sen and Senkou Span B lines are the lines of the Ichimoku indicator, moved to the one-hour chart from the 4-hour one. They are strong lines.
Extreme levels are thin red lines from which the price bounced earlier. They provide trading signals.
Yellow lines are trend lines, trend channels, and any other technical patterns.
Indicator 1 on the COT charts reflects the net position size of each category of traders.
Indicator 2 on the COT charts reflects the net position size for the non-commercial group.