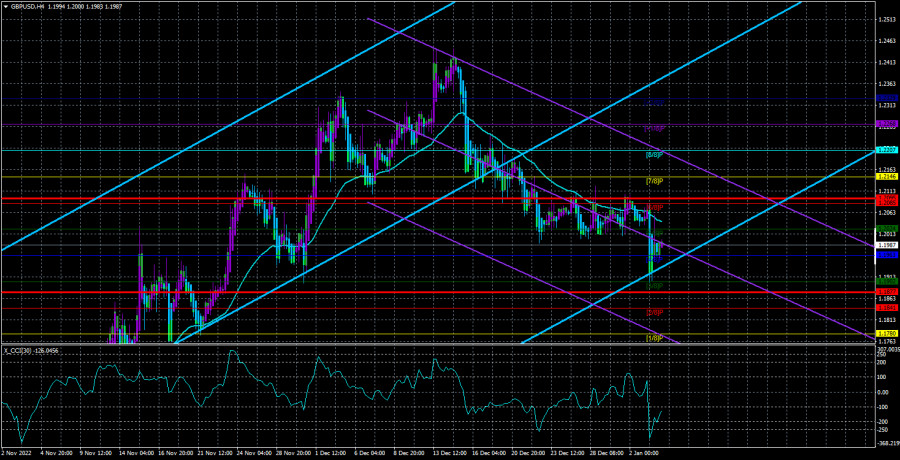
On Tuesday, the GBP/USD currency pair resumed its downward trend after a week and a half of flat trading. The downward trend just continued throughout this time because it was unable to even break through the moving average line, and yesterday the fall started again. There are numerous reasons why we are anticipating a further decline in the value of the pound sterling, as we have stated numerous times. First, experts are currently most worried about the British economy. It is stronger than its European or American counterparts. Second, the UK has the highest inflation and has only slowed down once so far. Third, the Bank of England's ability to tighten monetary policy "to the bitter end" is seriously questioned. In other words, to a pace at which we can confidently predict that inflation will return to the target level in the near term, not in ten years. Fourth, the British pound increased by 2,000 points in just 2.5 months during the second half of the year, which we deem to be unwarranted and excessive. As a result, we anticipate a decline to roughly the 15th level.
After then, a protracted period of consolidation could start, during which moves of 400–500 points might alternate. Such a movement may appear as a flat or "swing" on a 24-hour TF, but we anticipate that in a few months, the market won't have enough variables to construct either an upward trend or a downward trend. There is a question that a new significant issue will emerge, which may steer the pair down a particular path for a considerable amount of time given the events of the previous three years, and, in the case of the UK, the previous six years. We would want to remind you that the coronavirus epidemic is still ongoing, that there is still a geopolitical crisis in Ukraine, and that Scotland could still leave the UK in the foreseeable future. While it is true that it is currently very difficult to predict how an independence referendum may proceed, this also shouldn't be wholly disregarded.
The goal of the pound is to decrease.
Even the typical macroeconomic numbers may not be sufficient for the British pound to stop dropping in the coming weeks or months. Yesterday is a good illustration of this. Trading went on, although there is no connection between German inflation and the British pound. As a result, in our judgment, technical factors now outweigh fundamental ones. After an unwarranted increase, the pound should adapt, and that says it all. This week, there won't be many significant publications or events in the UK. Indicators of business activity scarcely qualify as such, especially when we are discussing the second estimates of indicators for December.
As a result, the ISM indices for the US services and manufacturing sectors, as well as nonfarm payrolls and unemployment, will have readings for the pair for the remainder of the first week of 2023. The data is all imported. Although weak data can still readily and freely cause the US dollar to decline, the pattern is becoming more significant. Even with mediocre American figures, the trend is negative, thus we are anticipating a maximum pullback upward before the collapse should begin.
However, we do not think that the pound will attempt to reach its current absolute lows, which are close to the level of 1.0350, this year. There are also no solid justifications or bases for this. Although it is currently hard to determine when they will debut, they might do so in 2023. Nobody is certain of the future course of the military conflict in Ukraine or whether a new wave of a pandemic would spread around the world. The likelihood of a rise in the US dollar, which many continue to view as a "safe-haven" and the safest currency in the world, increases as the situation in Ukraine and throughout the world becomes more volatile.

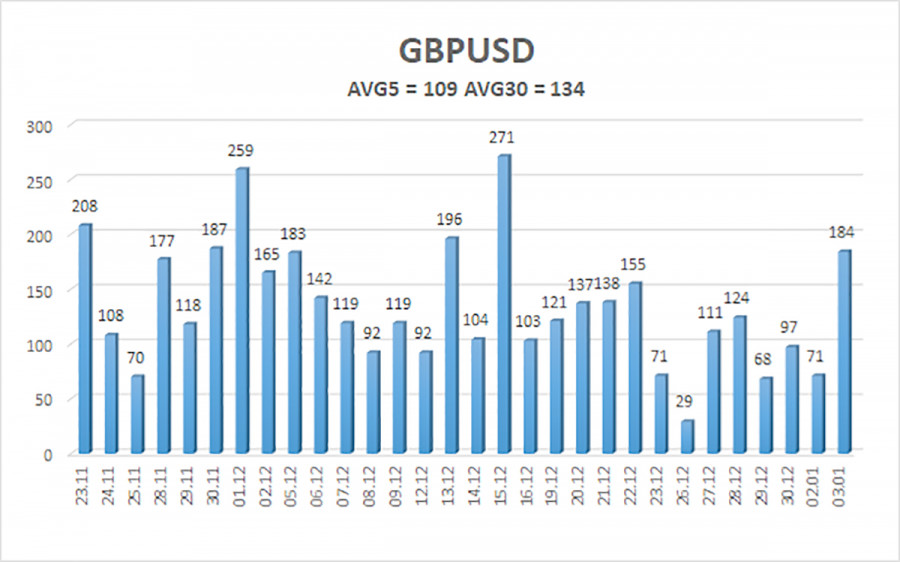
Over the previous five trading days, the GBP/USD pair has experienced an average volatility of 109 points. This number is the "average" for the pound/dollar exchange rate. So, on January 4, we anticipate movement that is contained within the channel and is constrained by the levels of 1.1877 and 1.2095. The Heiken Ashi indicator's downward turn indicates that the downward momentum has resumed.
Nearest levels of support
S1 – 1.1963
S2 – 1.1902
S3 – 1.1841
Nearest levels of resistance
R1 – 1.2024
R2 – 1.2085
R3 – 1.2146
Trading Suggestions:
In the 4-hour timeframe, the GBP/USD pair finished its sideways pattern and started back down. As a result, if the Heiken Ashi indicator reverses downward at this time, new short positions with objectives of 1.1902 and 1.1877 should be taken into consideration. Open long positions with goals of 1.2095 and 1.2146 as soon as the price is fixed above the moving average.
Explanations for the illustrations:
Determine the present trend with the use of linear regression channels. The trend is now strong if they are both moving in the same direction.
Moving average line (settings 20.0, smoothed): This indicator identifies the current short-term trend and the trading direction.
Murray levels serve as the starting point for adjustments and movements.
Based on current volatility indicators, volatility levels (red lines) represent the expected price channel in which the pair will trade the following day.
A trend reversal in the opposite direction is imminent when the CCI indicator crosses into the overbought (above +250) or oversold (below -250) zones.


