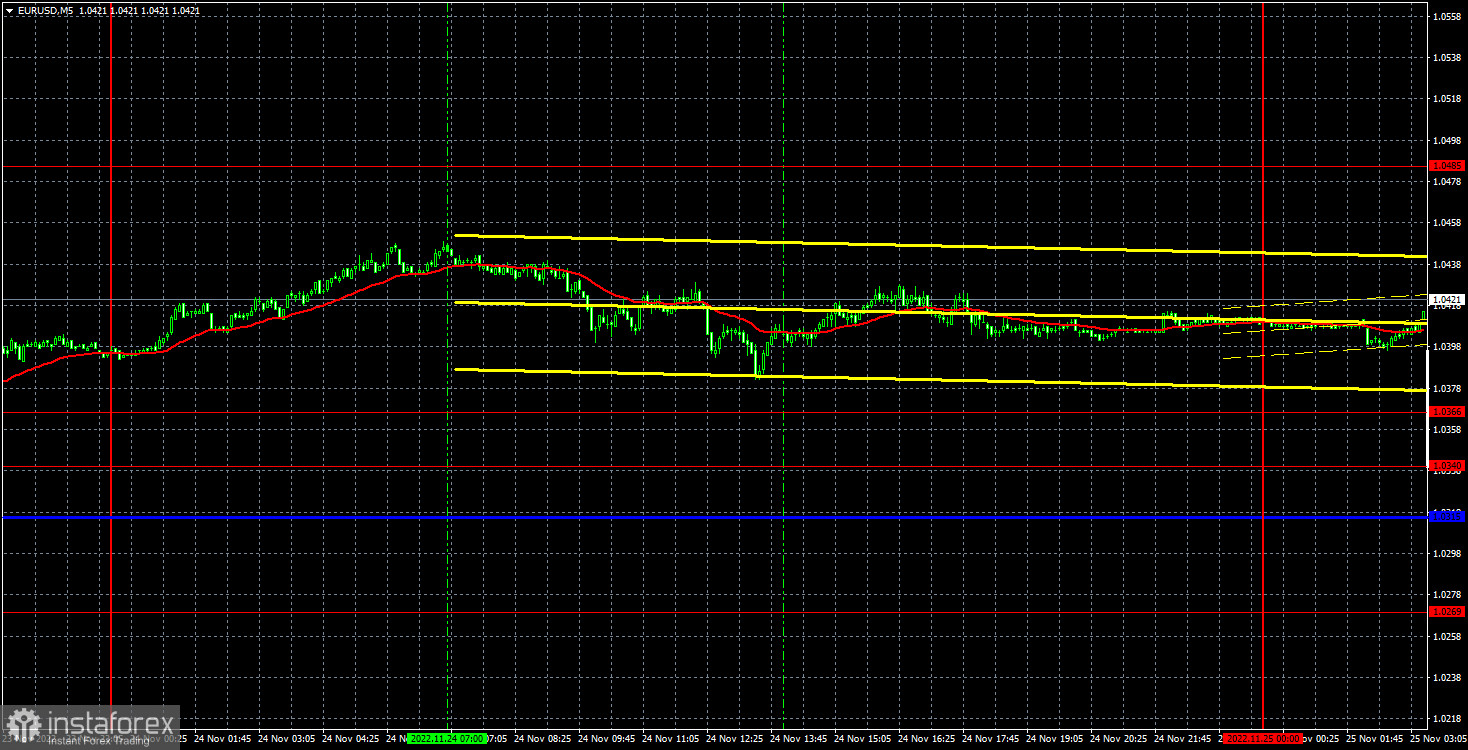
empty
25.11.2022 07:13 AM
Forecast and trading signals for EUR/USD on November 25, 2022. COT report. Detailed analysis of price movement and trades. EUR may head back to Senkou Span B

M5 chart of EUR/USD

This image is no longer relevant

On Thursday, the euro/dollar pair entered a bearish correction following the steep growth of the past several days. As a reminder, the price consolidated below the ascending trend line. Given this fact, we could anticipate a continuation of the downtrend. However, the quote failed to settle below the Senkou Span B. So, the euro has been bullish over the past several days. Still, there have been hardly any reasons for this increase. It may well be that the euro simply followed the pound's suit. Indeed, the sterling advanced considerably following the ruling of the Supreme Court against holding a new independence referendum by Scotland's government. Nevertheless, it is just a theory. Speaking of the macroeconomic calendar that contained important releases only on Wednesday, it remains unclear why the euro went up anyway. Given that the price is still below the swing high, the bearish correction may extend to the Senkou Span B.

When it comes to trading signals on Thursday, the 5-minute chart shows that the pair traded mostly horizontally. In other words, no trading signals were made on Thursday, so there was no need to open trades at all.
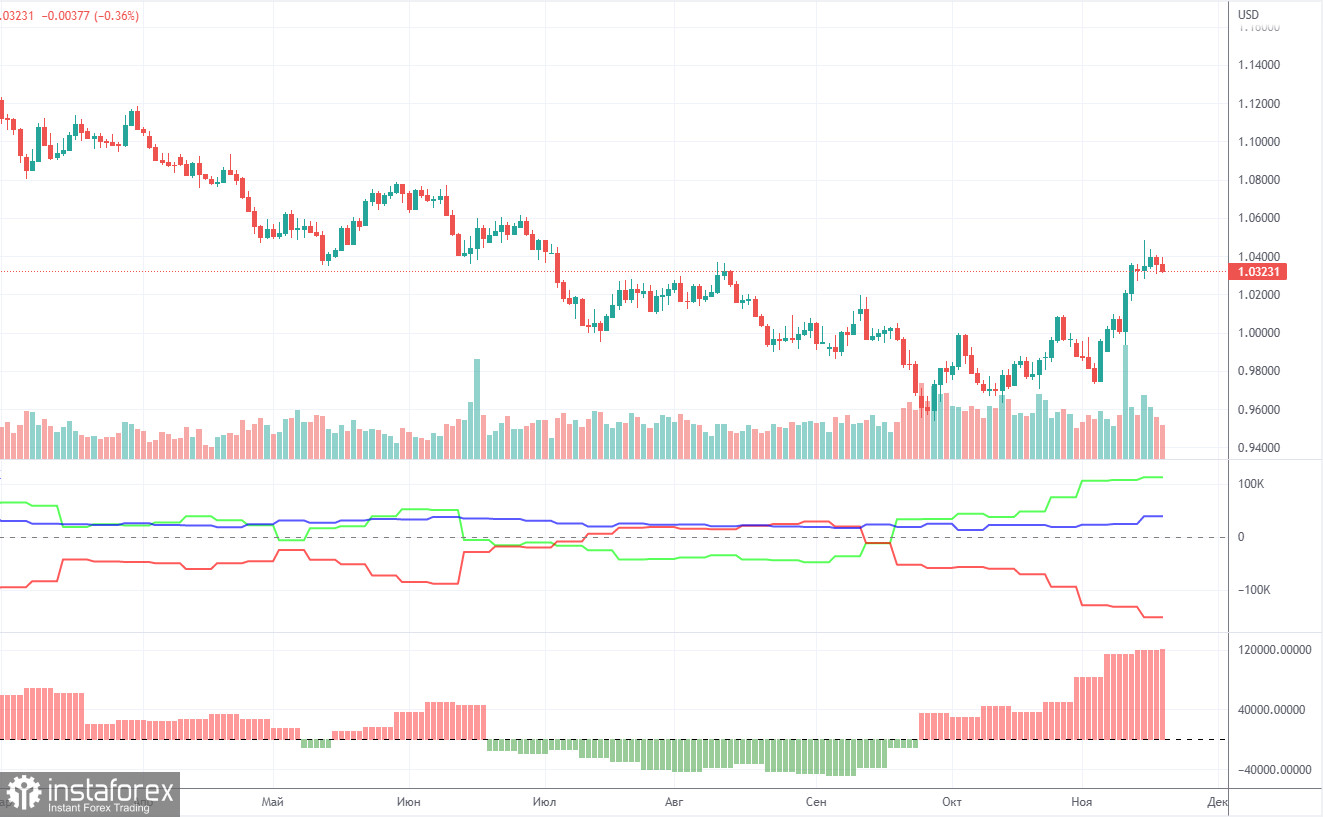
COT report:

This image is no longer relevant

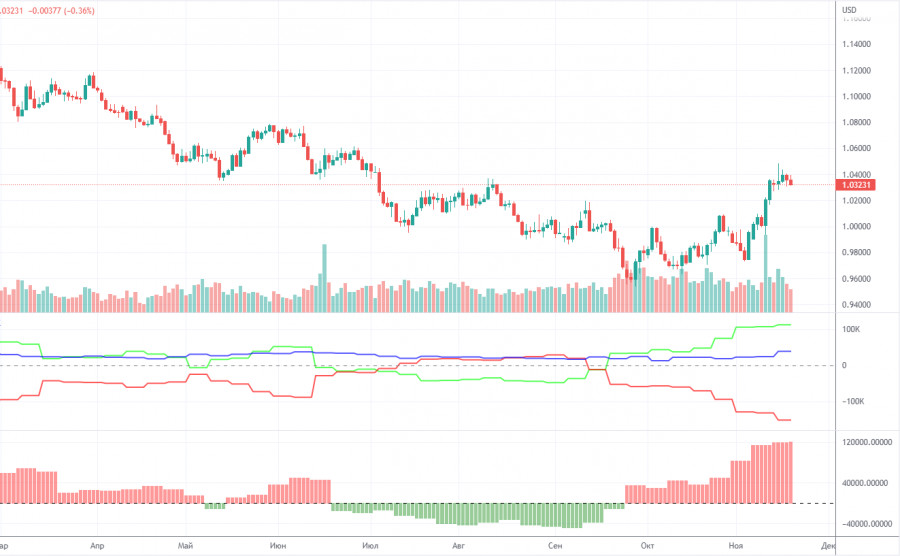
As for COT reports in 2022, they reflected bullish sentiment in the first six months of the year although the euro was bearish. Then, they illustrated bearish sentiment for several months with the euro being also bearish. Currently, the net position of non-commercial traders is again bullish and increasing. Meanwhile, the euro has hardly retreated from its 20-year lows. This is due to the fact that demand for the greenback is high amid a difficult geopolitical situation in the world. Therefore, despite a rise in demand for the euro, buoyant demand for the dollar does not allow the euro to strengthen. During the reporting week, the number of long positions held by non-commercial traders rose by 7,000 and that of short positions increased by 2,000. Consequently, the net position advanced by 5,000. The euro's recent growth is gradually coming in line with the figures illustrated in the COT report. Still, the greenback may resume growth under the influence of geopolitical factors or the lack of factors for further strengthening in the euro. The green and red lines of the first indicator moved far away from each other, which may indicate the end of the uptrend. The number of long positions exceeds that of short positions by 113,000. Therefore, the net position of non-commercial traders may continue to rise further, but without triggering a similar rise in the euro. When it comes to the total number of longs and shorts across all categories of traders, there are now 39,000 more short positions (635,000 vs 596,000).
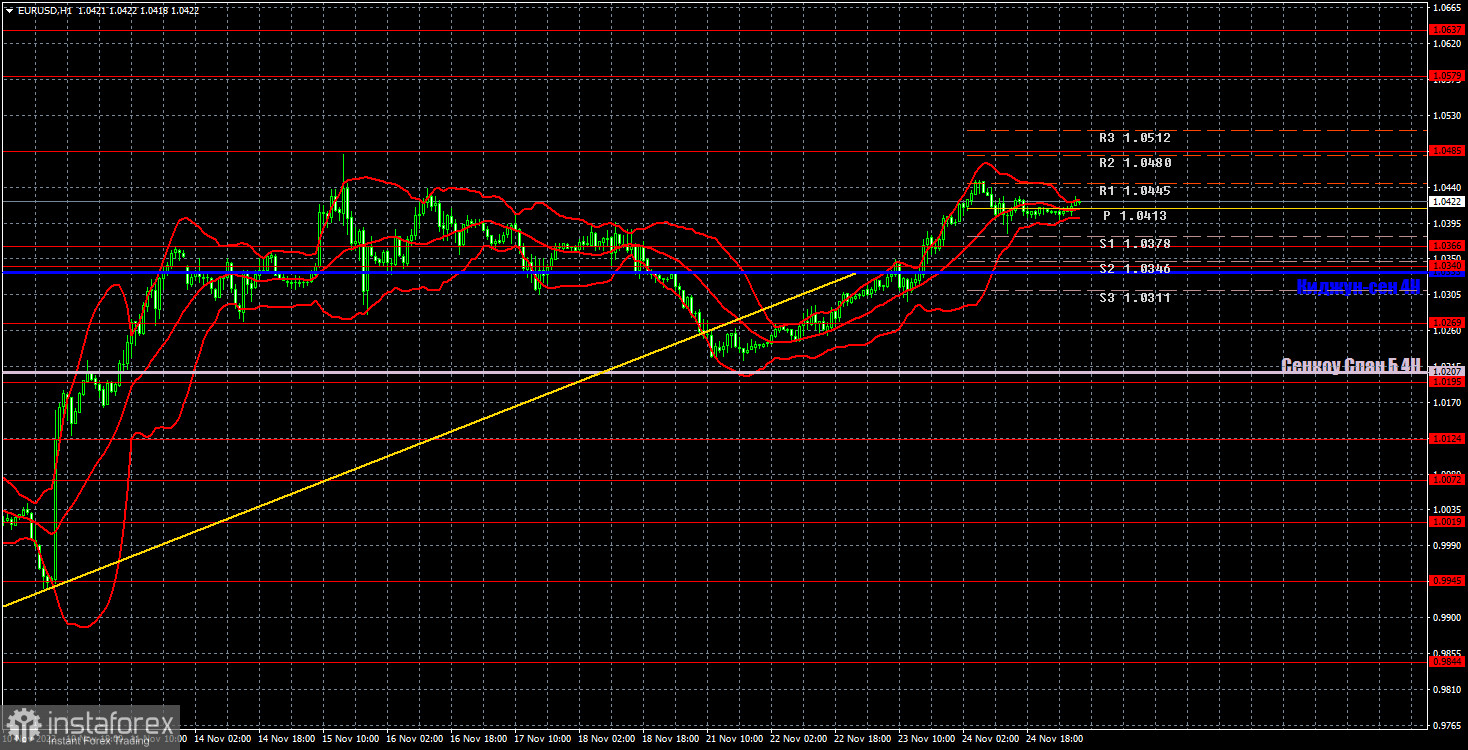
H1 chart of EUR/USD

This image is no longer relevant

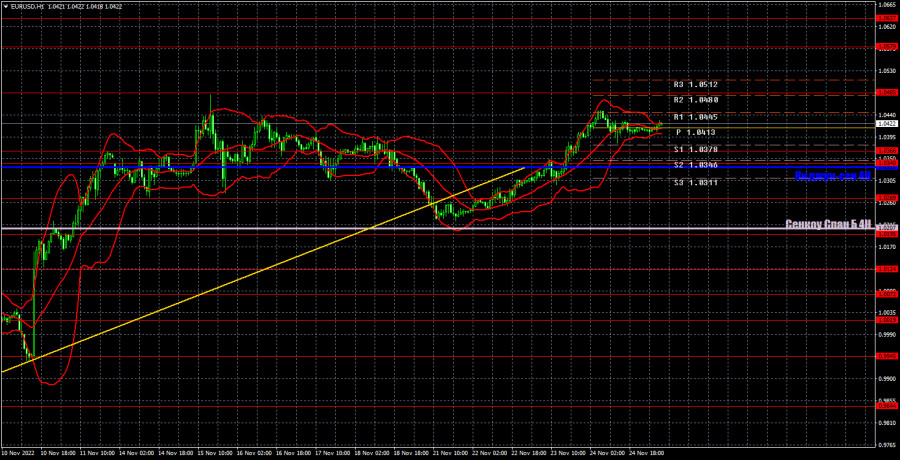
In the H1 time frame, EUR/USD may resume the uptrend and update its latest swing high. Although the price broke through the trend line, fundamental factors provide little support for the euro. Therefore, the market is now bullish. Anyway, we are still anticipating a strong bearish correction. On Friday, trading levels are seen at 1.0119, 1.0195, 1.0269, 1.0340-1.0366, 1.0485, 1.0579, 1.0637, as well as Senkou Span B (1.0207) and Kijun-sen (1.0333). Ichimoku indicator lines may move during the day, which should be taken into account when determining trading signals. There are also support and resistance although no signals are made near these levels. Signals can be generated whenever the price bounces or breaks through extreme levels and lines. Don't forget to place a stop-loss order at the breakeven point when the price passes 15 pips in the right direction. It can help you minimize losses when a signal turns out to be false. On November 25th, Luis de Guindos, the Vice-President of the ECB, will give an interview. Given that the European regulator is likely to remain aggressive, which traders are prepared for, his speech will hardly influence the market. In the United States, no interesting macro releases are due.

Indicators on charts:

Resistance/support - thick red lines, near which the trend may stop. They do not make trading signals.

The Kijun-sen and Senkou Span B lines are the Ichimoku indicator lines moved to the hourly timeframe from the 4-hour timeframe. They are also strong lines.

Extreme levels are thin red lines, from which the price used to bounce earlier. They can produce trading signals.

Yellow lines are trend lines, trend channels, and any other technical patterns.

Indicator 1 on the COT chart is the size of the net position of each trader category.

Indicator 2 on the COT chart is the size of the net position for the Non-commercial group of traders.

Paolo Greco,
Especialista em análise na InstaForex
© 2007-2025
Selecionar intervalo de tempo
5
min
15
min
30
min
1
hora
4
horas
1
dia
1
s.
Ganhe com as variações das taxas das criptomoedas com a InstaForex.
Baixe o MetaTrader 4 e abra a sua primeira operação.
  • Grand Choice
    Contest by
    InstaForex
    InstaForex always strives to help you
    fulfill your biggest dreams.
    PARTICIPE DO CONCURSO

Recommended Stories

EUR/USD: Plano de Negociação para a Sessão dos E.U.A. de 14 de março (Revisão das Negociações da Manhã)

Na minha previsão da manhã, foquei no nível 1,0852 e planejei basear minhas decisões de negociação nele. Vamos examinar o gráfico de 5 minutos para ver o que aconteceu

Miroslaw Bawulski 21:10 2025-03-14 UTC+2

GBP/USD: Plano de Negociação para a Sessão dos E.U. de 11 de março (Análise das Negociações da Manhã). Compradores de Libra buscam uma nova máxima semanal

Na minha previsão da manhã, concentrei-me no nível 1,2876 e planejei tomar decisões de negociação com base nele. Vamos dar uma olhada no gráfico de 5 minutos e analisar

Miroslaw Bawulski 20:53 2025-03-11 UTC+2

EUR/USD: Plano de Negociação para a Sessão dos E.U. de 11 de março (Revisão das Negociações da Manhã). O euro continuou a subir e atualizou sua alta semanal

Na minha previsão da manhã, foquei no nível de 1,0886 e planejei tomar decisões de negociação com base nele. Vamos dar uma olhada no gráfico de 5 minutos e analisar

Miroslaw Bawulski 20:43 2025-03-11 UTC+2

Como negociar o GBP/USD em 7 de março? Dicas simples e análise de negociação para iniciantes

O par GBP/USD também se estabilizou na quinta-feira. Não houve razões fundamentais ou macroeconômicas que justificassem a alta ou queda da libra esterlina ou do dólar americano

Paolo Greco 16:17 2025-03-07 UTC+2

GBP/USD: Plano de Negociação para a Sessão dos E.U.A de 18 de fevereiro (Revisão das Negociações da Manhã)

Em minha previsão matinal, foquei no nível 1,2627 como um ponto-chave para as decisões de entrada no mercado. Olhando para o gráfico de 5 minutos, o par se moveu mais

Miroslaw Bawulski 16:52 2025-02-18 UTC+2

GBP/USD: Plano de negociação para a sessão dos E.U.A. de 14 de fevereiro (revisão da negociação da manhã)

Na minha previsão da manhã, foquei no nível 1,2568 e planejei tomar decisões de negociação com base nele. Vamos dar uma olhada no gráfico de 5 minutos e analisar

Miroslaw Bawulski 22:05 2025-02-14 UTC+2

GBP/USD: Plano de negociação para a sessão dos E.U.A. de 13 de fevereiro (análise das negociações da manhã)

Na minha previsão da manhã, me concentrei no nível 1,2505 e planejei tomar decisões de negociação com base nele. Vamos examinar o gráfico de 5 minutos para

Miroslaw Bawulski 21:41 2025-02-13 UTC+2

EUR/USD: Plano de negociação para a sessão dos E.U.A. de 13 de fevereiro (análise das negociações da manhã)

Na minha previsão da manhã, concentrei-me no nível 1,0440 e planejei tomar decisões de negociação com base nele. Vamos examinar o gráfico de 5 minutos para ver o que aconteceu

Miroslaw Bawulski 20:03 2025-02-13 UTC+2

Recomendações e análise de negociação para o GBP/USD em 10 de fevereiro

O par GBP/USD voltou a se recuperar a partir de sua linha de tendência ascendente na sexta-feira, sugerindo uma possível continuação da tendência de alta. Na segunda-feira, o par sofreu

Paolo Greco 16:51 2025-02-10 UTC+2

Recomendações de negociação e análise de negociação para o EUR/USD em 10 de fevereiro

O par EUR/USD apresentou movimentos de preço consistentes na sexta-feira, embora o dólar norte-americano tenha se fortalecido no final do dia. No entanto, seus ganhos não foram expressivos

Paolo Greco 15:38 2025-02-10 UTC+2
Não pode falar agora?
Faça sua pergunta no chat.
Widget callback
 

Dear visitor,

Your IP address shows that you are currently located in the USA. If you are a resident of the United States, you are prohibited from using the services of InstaFintech Group including online trading, online transfers, deposit/withdrawal of funds, etc.

If you think you are seeing this message by mistake and your location is not the US, kindly proceed to the website. Otherwise, you must leave the website in order to comply with government restrictions.

Why does your IP address show your location as the USA?

  • - you are using a VPN provided by a hosting company based in the United States;
  • - your IP does not have proper WHOIS records;
  • - an error occurred in the WHOIS geolocation database.

Please confirm whether you are a US resident or not by clicking the relevant button below. If you choose the wrong option, being a US resident, you will not be able to open an account with InstaForex anyway.

We are sorry for any inconvenience caused by this message.