Details of the economic calendar of November 1
The final data on the UK manufacturing purchasing managers' index (PMI) for October declined to 46.2 from 48.4 in September, which is slightly better than the preliminary estimate of 46.2 points.
United States manufacturing PMI was also published, which rose from 49.9 to 50.4 points.
Also, data on job openings in the US were published, which saw an increase from 10.2 million to 10.7 million. The growth of vacancies is a positive signal regarding the affairs of the labor market in the US. At the time of publication of the data, the US dollar received support from buyers.
Analysis of trading charts from November 1
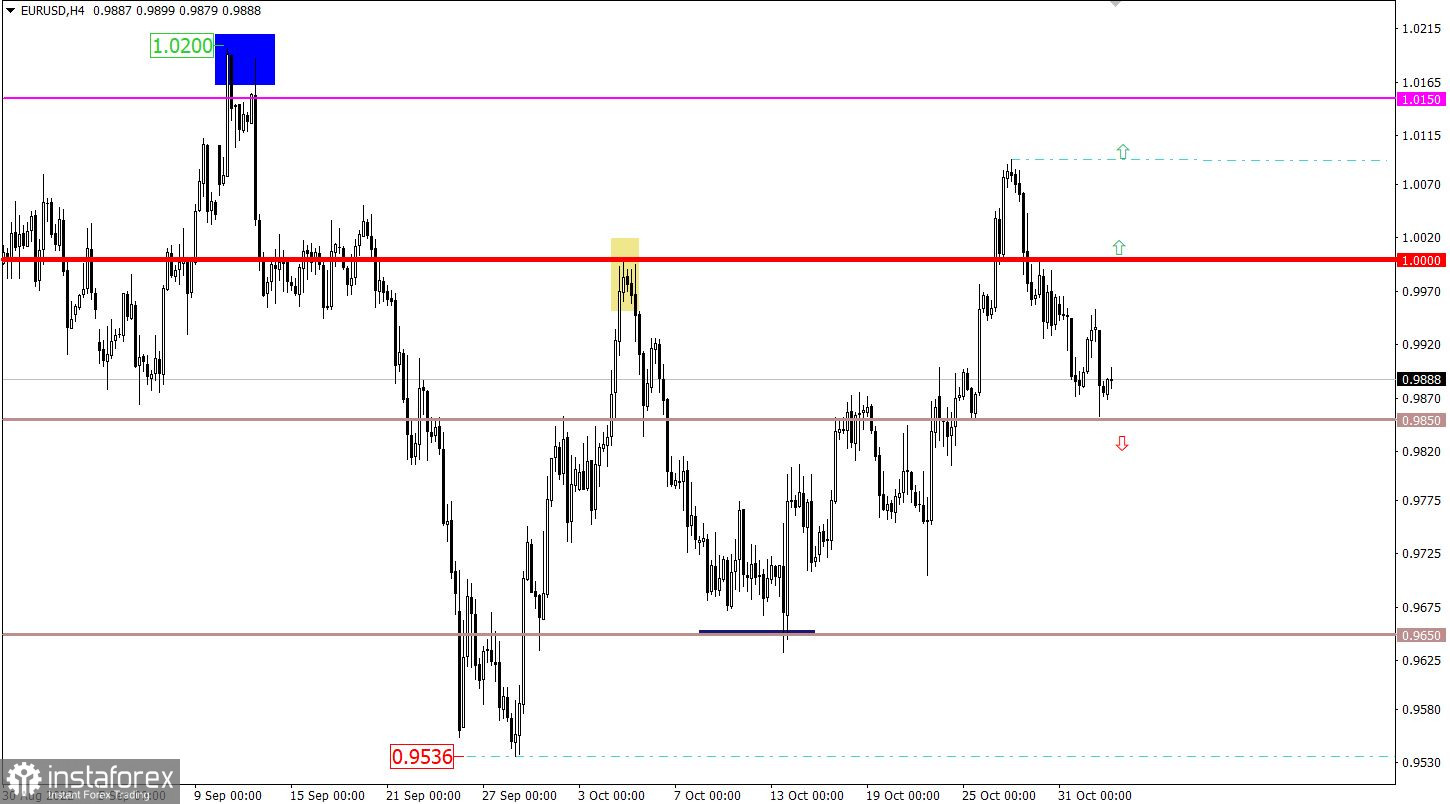
During the speculative activity, the EURUSD currency pair came close to the value of 0.9850, where characteristic regroupings of trading forces have repeatedly occurred in history. In our case, the convergence of the price to these values led to a reduction in the volume of short positions.
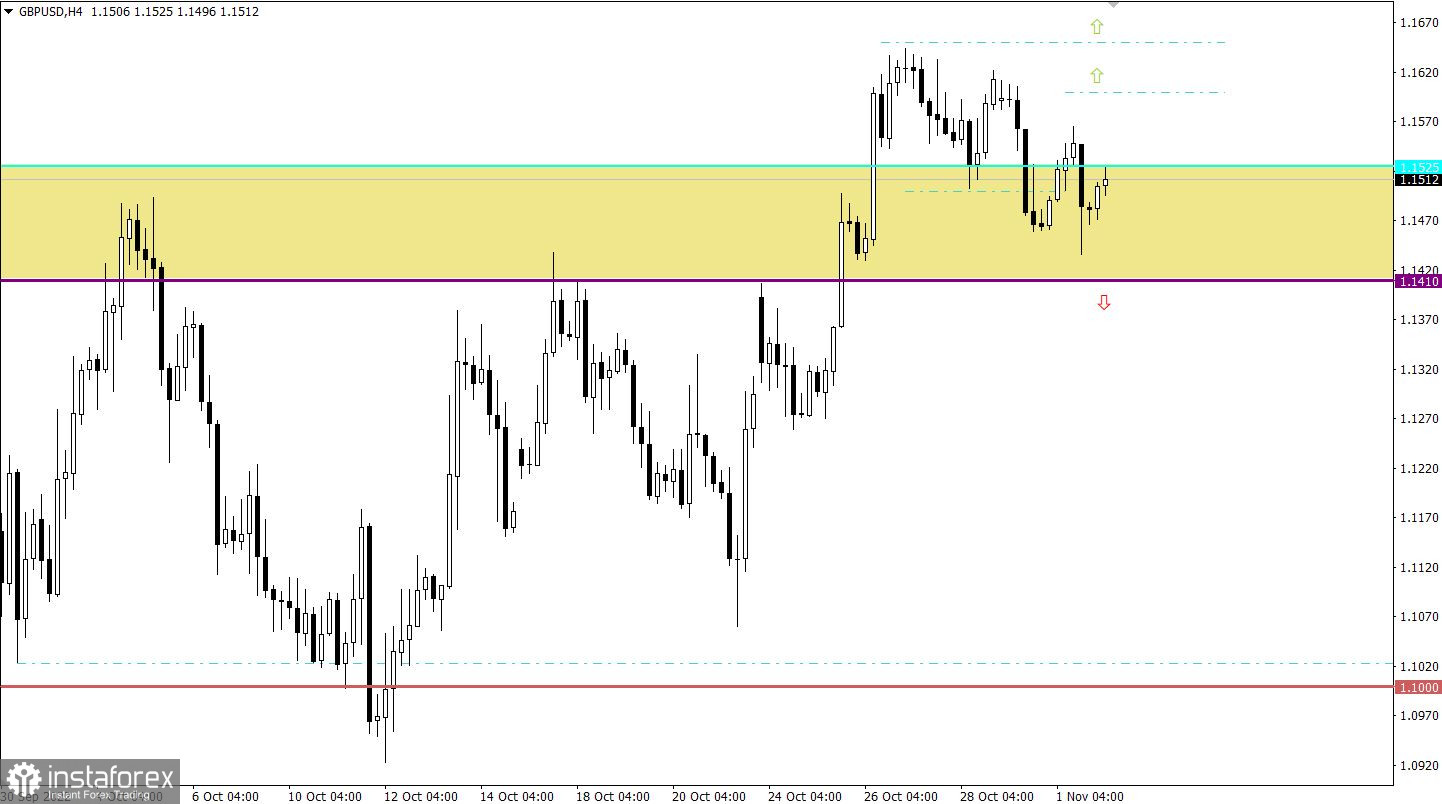
The GBPUSD currency pair is moving within the boundaries of the previously passed level 1.1410/1.1525, while showing medium activity. To a greater extent, the fluctuations of the last days resemble a characteristic stagnation, where the 1.1410/1.1525 area plays the role of a support.
Economic calendar for November 2
Today is one of the most anticipated days in the financial markets, this is due to the results of the Fed meeting, where the regulator is highly likely to raise interest rates by 75 basis points. The change in the rate has already been taken into account in quotes, special attention will be paid to the Fed's comments regarding their future plans.
What to expect from the regulator?
If we hear clear statements from the regulator that it is worth taking a break in raising the interest rate, then this news will immediately lead to a bullish rally in the US stock market, as well as to a total sell-off of the dollar. A similar reaction will arise if the rate is raised by 50 bps instead of 75 bps.
If the Fed says that an even higher rate increase is needed, in this case—75 bps, then this news will be won back by the market in terms of a sell-off on the US stock exchanges and will lead to a sharp strengthening of the dollar.
If the Fed masterfully avoids clear answers and continues to say that it is necessary to monitor statistical data, this will also be a negative for US stock markets. It is worth noting that in this scenario, the scale of speculation will be smaller than in the second option.
Time targeting:
Fed meeting results - 18:00 UTC
Fed press conference - 18:30 UTC
Trading plan for EUR/USD on November 2
Speculative activity will continue today due to an important economic event. This does not rule out strong price jumps of more than 100 points during the American trading session. As for the technical picture, the lack of keeping the price below the value of 0.9850 may lead to a gradual increase in the value of the euro in the direction of parity. If the quote still manages to stay lower than 0.9850 in a four-hour period, there is a high probability of moving towards the values of 0.9780–0.9700.
Trading plan for GBP/USD on November 2
It can be assumed that the area of the current level will still have an impact on the positions of traders. This will not last long, as a speculative jump in activity is highly likely to occur during the American session.
As for price movements, the upward cycle will be considered by traders in case the price returns above the 1.1600 mark. While for a downward development, the quote needs to stay below the 1.1400 mark.
What is shown in the trading charts?
A candlestick chart view is graphical rectangles of white and black light, with sticks on top and bottom. When analyzing each candle in detail, you will see its characteristics of a relative period: the opening price, closing price, and maximum and minimum prices.
Horizontal levels are price coordinates, relative to which a stop or a price reversal may occur. These levels are called support and resistance in the market.
Circles and rectangles are highlighted examples where the price of the story unfolded. This color selection indicates horizontal lines that may put pressure on the quote in the future.
The up/down arrows are the reference points of the possible price direction in the future.