GBP/USD 5M
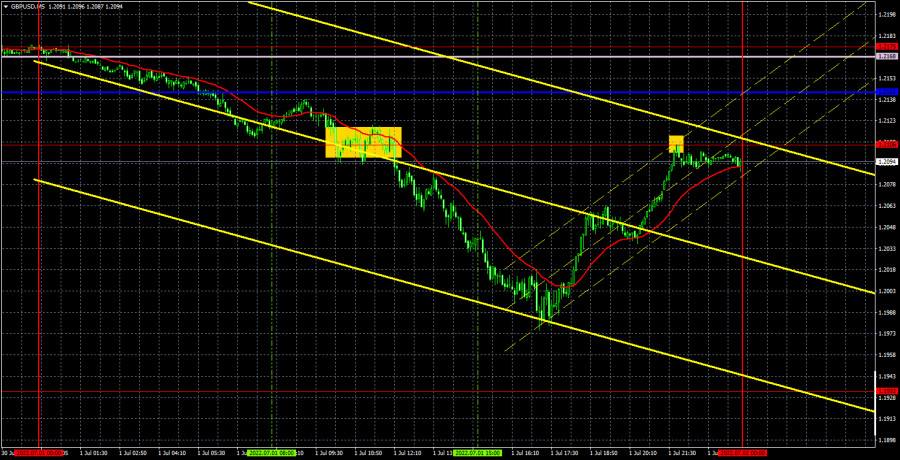
The GBP/USD currency pair showed extra volatility last Friday. It passed more than 200 points from high to low during the day. Recall that on Friday there was not a single important event in the UK, and in the US there was only one ISM business activity index in the manufacturing sector. This index turned out to be much worse than forecasts and provoked a fall of the dollar by 100 points after its release. That is, it passed 200 points before the only important report of the day. As a result of this movement, the pound/dollar pair was in close proximity to its 2-year lows, but it was the ISM index that ruined everything for both the euro/dollar and the pound/dollar. Considering that both currencies fell on Friday night and all day long, if not for this report, the lows could have been updated. And so this moment is postponed for some time. Not for long...
Things were much better with the trading signals for the pound/dollar pair. There were few. Just one, but was very good. The price overcame the level of 1.2106 in the middle of the European trading session, after which it went down 114 points. It did not reach the 1.1932 target level, however, when the ISM report was released, it became clear that the US currency would not be able to continue growing, so the deal could be closed, albeit belatedly. Therefore, it was possible to earn at least 80-90 points on a short position.
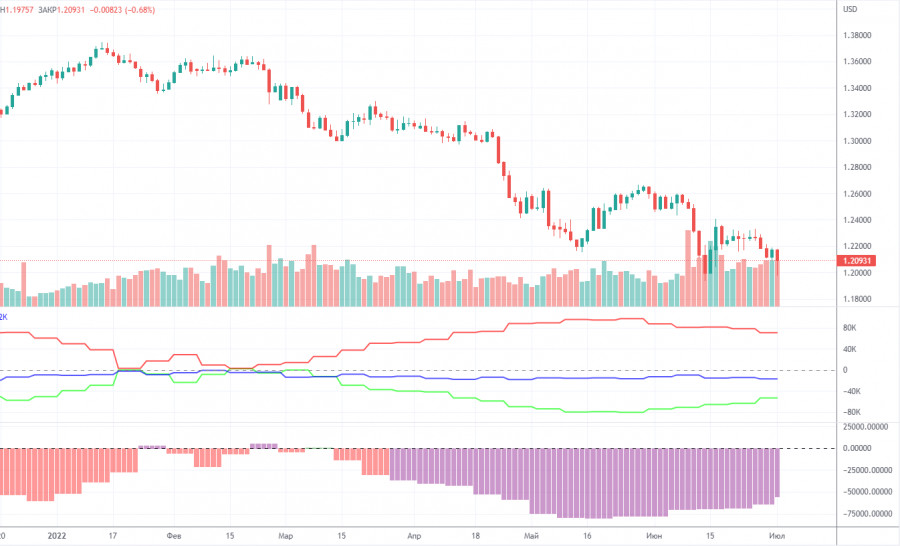
COT report:

The latest Commitment of Traders (COT) report again showed insignificant changes. During the week, the non-commercial group opened 6,700 long positions and closed 3,400 short positions. Thus, the net position of non-commercial traders increased by 10,000. However, the mood of major players still remains "pronounced bearish", which is clearly seen from the second indicator in the chart above. And the pound, despite the increase in the net position, still cannot show even a tangible upward correction. The net position has been falling for three months, now it is rising, but what difference does it make if the British currency is depreciating anyway? We have already said that the COT reports for the pound do not take into account the demand for the dollar, which is likely to remain very high right now. Consequently, even for the strengthening of the British currency, it is required that demand for it grows faster and stronger than demand for the dollar. The non-commercial group currently has a total of 88,000 short positions open and only 35,000 longs. The net position will have to show growth for a long time to at least equalize these figures. Neither macroeconomic statistics nor fundamental events support the UK currency. As before, we can only count on corrective growth, but we believe that the pound will continue to fall in the medium term.
We recommend to familiarize yourself with:
Overview of the EUR/USD pair. July 4. The euro will celebrate the US Independence Day near its 20-year lows.
Overview of the GBP/USD pair. July 4. What does the NonFarm Payrolls report prepare for us?
Forecast and trading signals for EUR/USD on July 4. Detailed analysis of the movement of the pair and trading transactions.
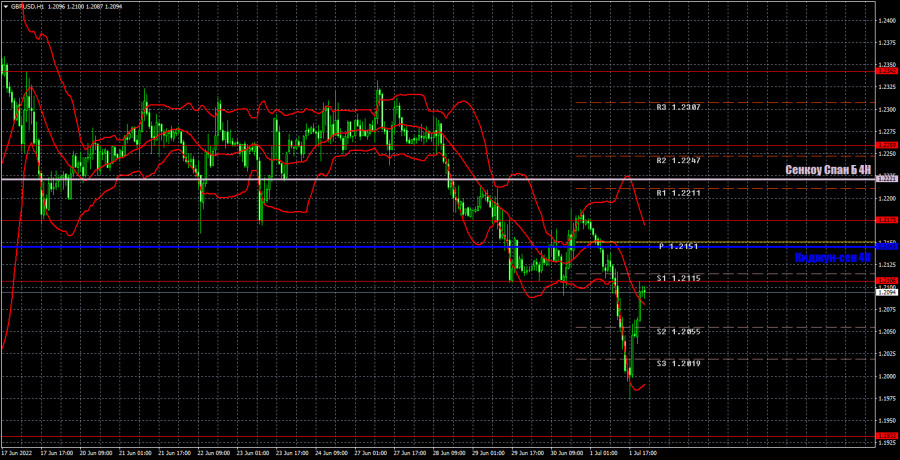
GBP/USD 1H

It is clearly seen that the flat or "swing" is over on the hourly timeframe. The pair resumed its downward trend and, although it failed to renew its 2-year lows, one must take into account the fact that on Friday it just crept back to them. Thus, the failure on Friday does not mean at all that the bears retreated from the market again. It is possible that this week we will see a continuation of the downward movement. For July 4, we highlight the following important levels: 1.1932, 1.2106, 1.2259, 1.2342. Senkou Span B(1.2221) and Kijun-sen(1.2145) lines can also be sources of signals. Signals can be "rebounds" and "breakthrough" of these levels and lines. The Stop Loss level is recommended to be set to breakeven when the price passes in the right direction by 20 points. Ichimoku indicator lines can move during the day, which should be taken into account when determining trading signals. The chart also contains support and resistance levels that can be used to take profits on trades. No fundamental events, no macroeconomic reports are planned for Monday either in the UK or in the US. Moreover, today is a public holiday in the US, so US traders will be out of the market. We expect weak movements and weak volatility.
Explanations for the chart:
Support and Resistance Levels are the levels that serve as targets when buying or selling the pair. You can place Take Profit near these levels.
Kijun-sen and Senkou Span B lines are lines of the Ichimoku indicator transferred to the hourly timeframe from the 4-hour one.
Support and resistance areas are areas from which the price has repeatedly rebounded off.
Yellow lines are trend lines, trend channels and any other technical patterns.
Indicator 1 on the COT charts is the size of the net position of each category of traders.
Indicator 2 on the COT charts is the size of the net position for the non-commercial group.


