Analysis of EUR/USD 5M
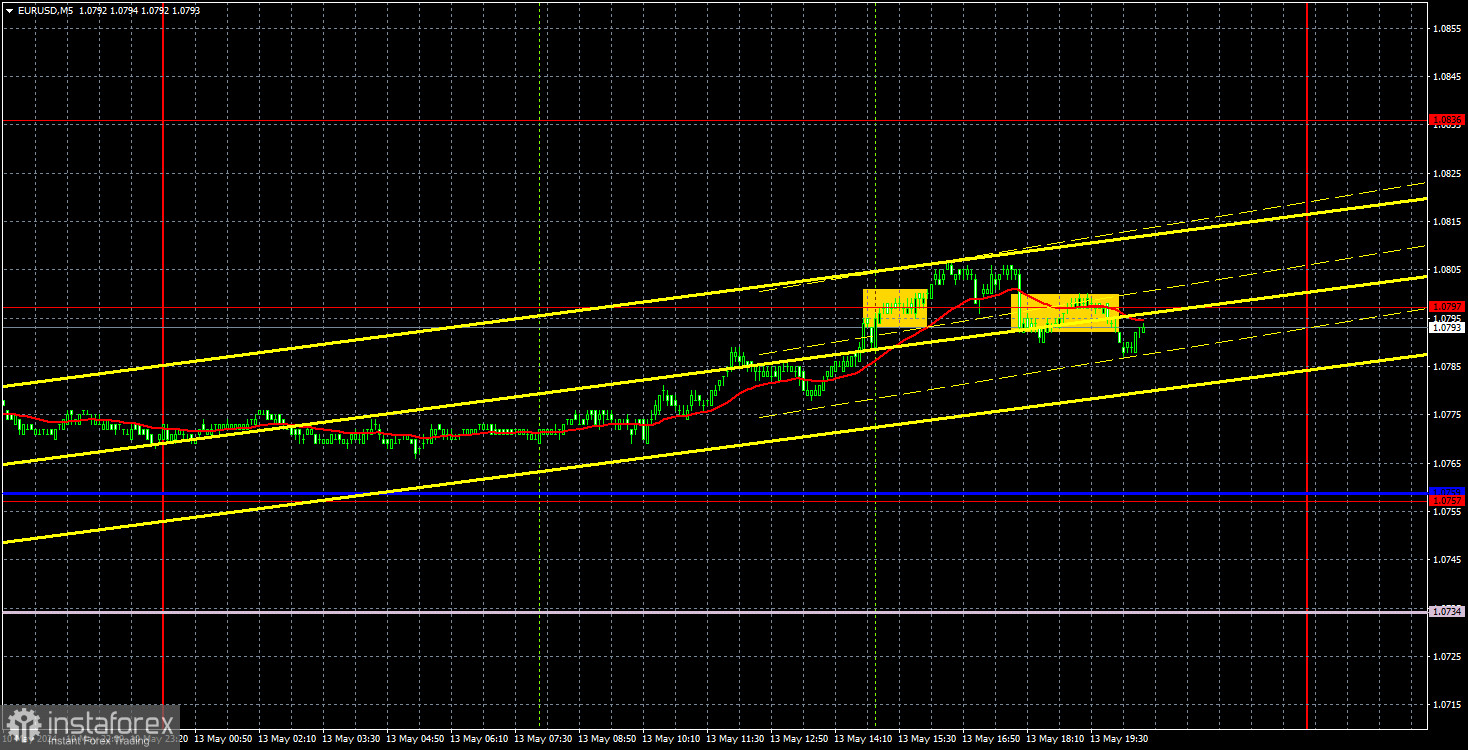
The EUR/USD went through low volatility on Monday. The euro edged higher, but the pair's movements were so weak that it's hard to say who managed to benefit from just 20 pips. The pair remains near the upper line of the ascending channel, which maintains the prospects of the bullish correction. This has been ongoing for a month. There is no doubt that this is a correction; a quick glance at the 4-hour timeframe makes it clear. Intraday movements are weak, and medium-term movements are slow.
Yesterday, there were no significant events or reports in either the Eurozone or the US. There were a few speeches by representatives of the Federal Reserve and the European Central Bank, but there have been so many of these lately that it's very difficult to expect new information. The market has stopped paying attention to the constant stream of similar information. It is now clear that the ECB is ready to move towards easing monetary policy, while the Fed is not. This should support the dollar, not the euro.
We may consider Monday's trading signals again. Two trading signals were formed during the day, but volatility was low, so we didn't even see 15 pips of movement in either case. Therefore, traders might have opened one or two trades today, but it was clear that we were in for another "boring Monday," which might sluggishly flow into a "boring Tuesday" and "boring Wednesday."
COT report:
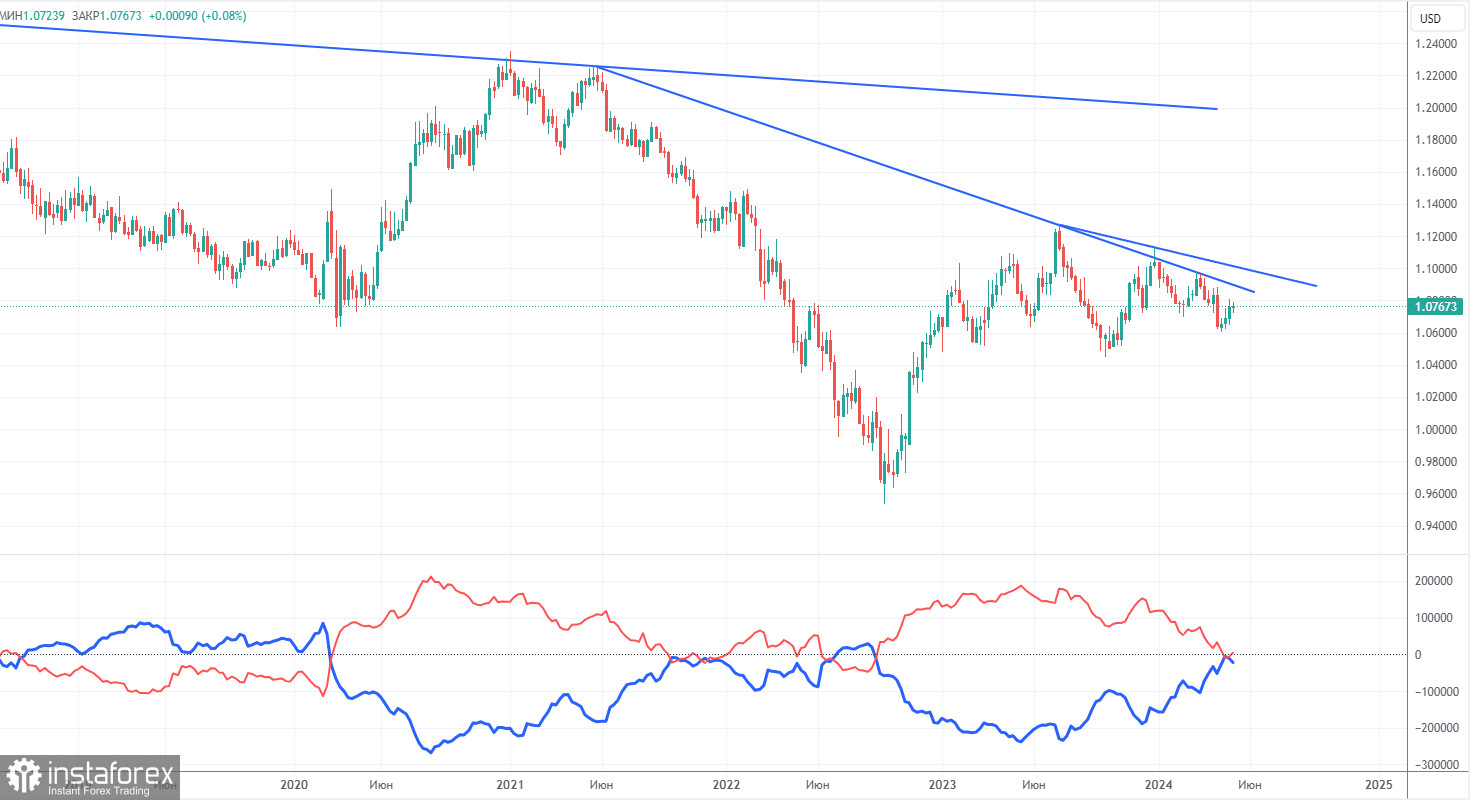
The latest COT report is dated May 7. The net position of non-commercial traders has been bullish for quite some time, but now the situation has finally changed. The net position of non-commercial traders (red line) has been decreasing in recent months, while that of commercial traders (blue line) has been increasing. This shows that market sentiment is turning bearish, as speculators increasingly sell the euro. Currently, their positions coincide in terms of volume. We don't see any fundamental factors that can support the euro's strength, while technical analysis also suggests a downtrend. Three descending trend lines on the weekly chart indicate that there's a good chance of continuing the decline.
The red and blue lines have crossed, and now bears may have a significant advantage. So we strongly believe that the euro will fall further. During the last reporting week, the number of long positions for the non-commercial group increased by 3,400, while the number of short positions decreased by 7,900. Accordingly, the net position increased by 12,300. Overall, both the euro and the net position continue to decline. The number of buy contracts is only higher than the number of sell contracts among non-commercial traders by 4,000.
Analysis of EUR/USD 1H
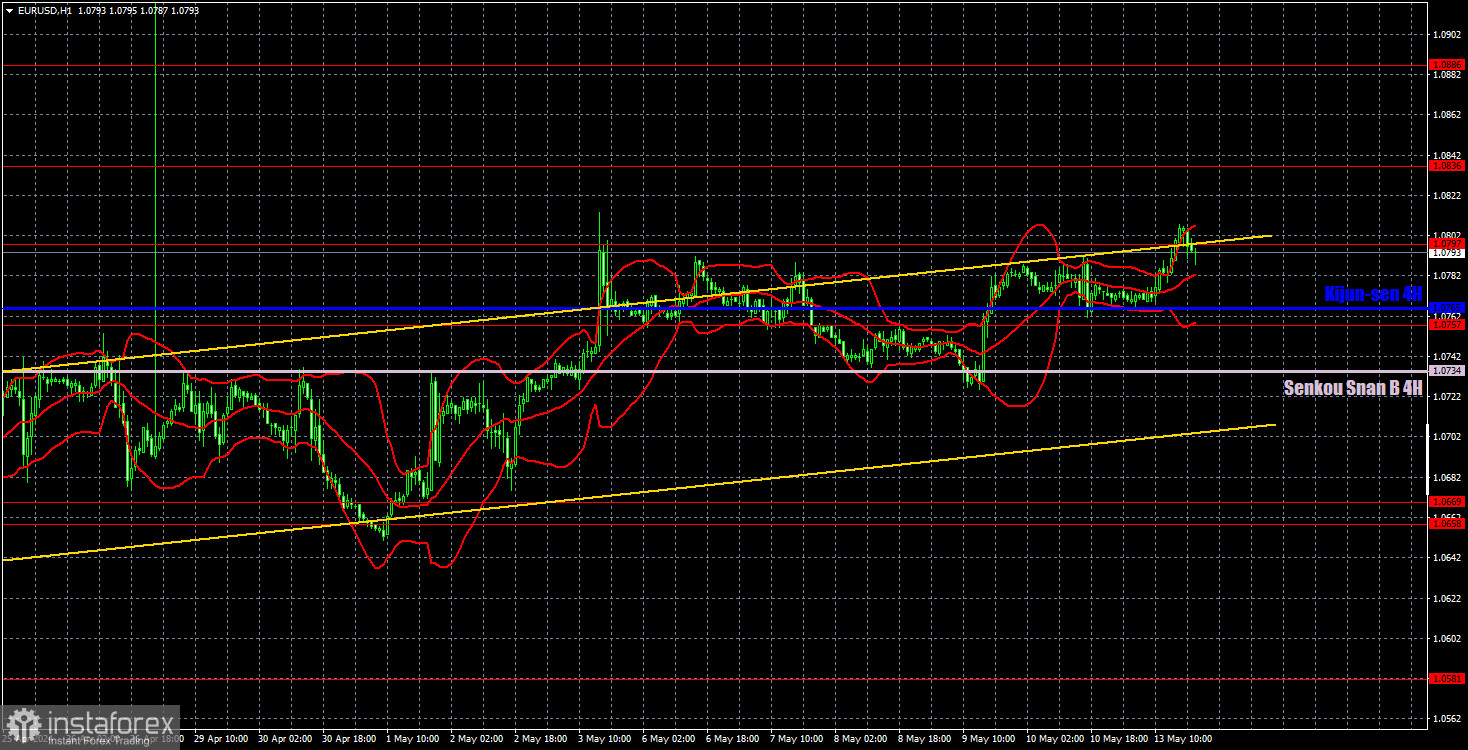
On the 1-hour chart, the EUR/USD pair has been going through a weak bullish correction against a global downward trend for three weeks now, and it spent last week absolutely flat. Since expectations for a Federal Reserve rate cut in 2024 have significantly decreased, the US currency should rise in the medium term. We still expect the price to consolidate below the ascending channel, and after that traders may consider selling again. Targets in the area of 1.00-1.04 remain relevant.
On May 14, we highlight the following levels for trading: 1.0530, 1.0581, 1.0658-1.0669, 1.0757, 1.0797, 1.0836, 1.0886, 1.0935, 1.1006, 1.1092, as well as the Senkou Span B line (1.0734) and Kijun-sen (1.0765). The Ichimoku indicator lines can move during the day, so this should be taken into account when identifying trading signals. Don't forget to set a Stop Loss to breakeven if the price has moved in the intended direction by 15 pips. This will protect you against potential losses if the signal turns out to be false.
The fundamentals and macroeconomics on Tuesday will be more interesting. The second estimate of Germany's inflation report for April will be released in the morning. Then, the ZEW economic sentiment indexes for Germany and the EU will be published. The US docket will feature the Producer Price Index. The day will conclude with a speech by Fed Chair Jerome Powell. Of course, the last event is the most important. Nevertheless, volatility may gradually increase.
Description of the chart:
Support and resistance levels are thick red lines near which the trend may end. They do not provide trading signals;
The Kijun-sen and Senkou Span B lines are the lines of the Ichimoku indicator, plotted to the 1H timeframe from the 4H one. They provide trading signals;
Extreme levels are thin red lines from which the price bounced earlier. They provide trading signals;
Yellow lines are trend lines, trend channels, and any other technical patterns;
Indicator 1 on the COT charts is the net position size for each category of traders;